 Growth is projected to rebound at around 15% in 2018 and an average 7.6% in 2019-20. Both the fiscal and current account balances will significantly improve, with the budget and the current account running surpluses expected from 2020 onwards Summary: At the current pace of spending in a context of conflict and insecurity, Libya will either exhaust foreign exchange reserves or be forced into ad hoc adjustments necessary to stave off crisis, but far from sufficient to reestablish growth foundations. The economic and social outlook assumes that political strife is resolved and a unified government can ensure macro-stability and launch a comprehensive program to rebuild the economic and social infrastructures. In this context, it is expected that oil production will progressively increase to reach its potential (around 1.5 million barrels per day (bpd)) by 2020, which is the time necessary to restore the heavily damaged oil infrastructure. Growth is projected to rebound at around 15% in 2018 and an average 7.6% in 2019-20. Both the fiscal and current account balances will significantly improve, with the budget and the current account running surpluses expected from 2020 onwards. Foreign reserves will also start building up by 2020. They will average US$72.5 billion during 2018-2020, representing the equivalent of 27.5 months of imports. However, high inflation coupled with weak basic service delivery are likely to have increased poverty and exacerbated socio-economic exclusion. In 2017, inflation accelerated, exacerbating further the hardship of the population. Prices of all commodities continued to increase, mainly driven by acute shortages in the supply chains of basic commodities, speculation in the expanding black markets, and the strong devaluation of the Libyan dinar (LYD) in the parallel markets. Consequently, inflation hit a record level of 28.4% in 2017 following the 25.9% in 2016. Full Report The relative economic improvement in 2017 remains fragile, as sustaining this dynamic depends crucially on a political resolution that in the current context seems hard to reach. The macroeconomic framework is unstable. It is characterized by record inflation and unsustainable twin deficits, mostly driven by rising budget expenditures. Dwindling savings are keeping pressure on foreign reserves and the LYD continued to lose its value in the parallel markets. To stabilize the macroeconomic framework, Libya needs to launch budget reforms and diversify the economy for growth and job creation. Recent developments Following four years of recession, the Libyan economy grew strongly in 2017, driven by a welcome recovery in oil production. However, sustaining this dynamic to reach economic potential depends on the resolve of the political strife. Exceptional but fragile implicit arrangements between the parties in conflict allowed the oil sector to more than double its production to an average 0.820 million barrels per day (bpd) in 2017, compared to only 0.380 million in 2016. The non-hydrocarbon sectors remained sluggish inhibited by lack of liquidity and security. GDP is estimated to have increased by almost 27 percent in 2017 allowing income per capita to substantially improve to 63 percent of its 2010 level after losing more than half of its value. Inflation accelerated, exacerbating further the hardship of the population. Prices of all commodities continued to increase, mainly driven by acute shortages in the supply chains of basic commodities, speculation in the expanding black markets, and the strong devaluation of the LYD in the parallel markets. Consequently, inflation hit a record level of 28.4 percent in 2017 following the 25.9 percent in 2016. High inflation coupled with weak basic service delivery are likely to have increased poverty and exacerbated socioeconomic exclusion. Despite higher hydrocarbon revenues, public finances remained under stress, given the high and rigid current expenditures driven by political motives. Budget revenues almost tripled in 2017 (31.8 percent of GDP) compared to 2016, but remained at half of potential. However, revenues were not even enough to cover public wages (36.4 percent of GDP), which increased due to political hires and higher salaries. Inefficient subsidies (9.2 percent of GDP) continued to absorb a significant amount of budget resources while capital expenditures remained weak (4.8 percent of GDP). Consequently, a high budget deficit persisted at 26 percent of GDP in 2017 (63.1 percent of GDP in 2016). The deficit is being financed mainly through cash advances from the Central Bank of Libya. The domestic debt has quickly increased to reach LYD 59 billion end September 2017, up from LYD 1 billion in 2010. Although improving, the balance of payments continues to suffer from politically constrained production and export of oil and high consumption-induced imports. Libya managed to substantially increase oil export in 2017 (0.7 million bpd), but remained at half of potential. This relative performance is not enough for a sustainable current account considering the high dependence of Libya on imports to meet consumption and intermediate goods requirements. As a result, the current account deficit remained high at an estimated 9.4 percent of GDP. This deficit was fully financed by net foreign financial inflow, allowing foreign reserves to remain unchanged in 2017 at around US$ 72.6 billion. While the pegged official exchange rate was kept stable, the Libyan Dinar lost around 85 percent of its value in the parallel market due to the weak macroeconomic fundamentals and an illiquid banking system. 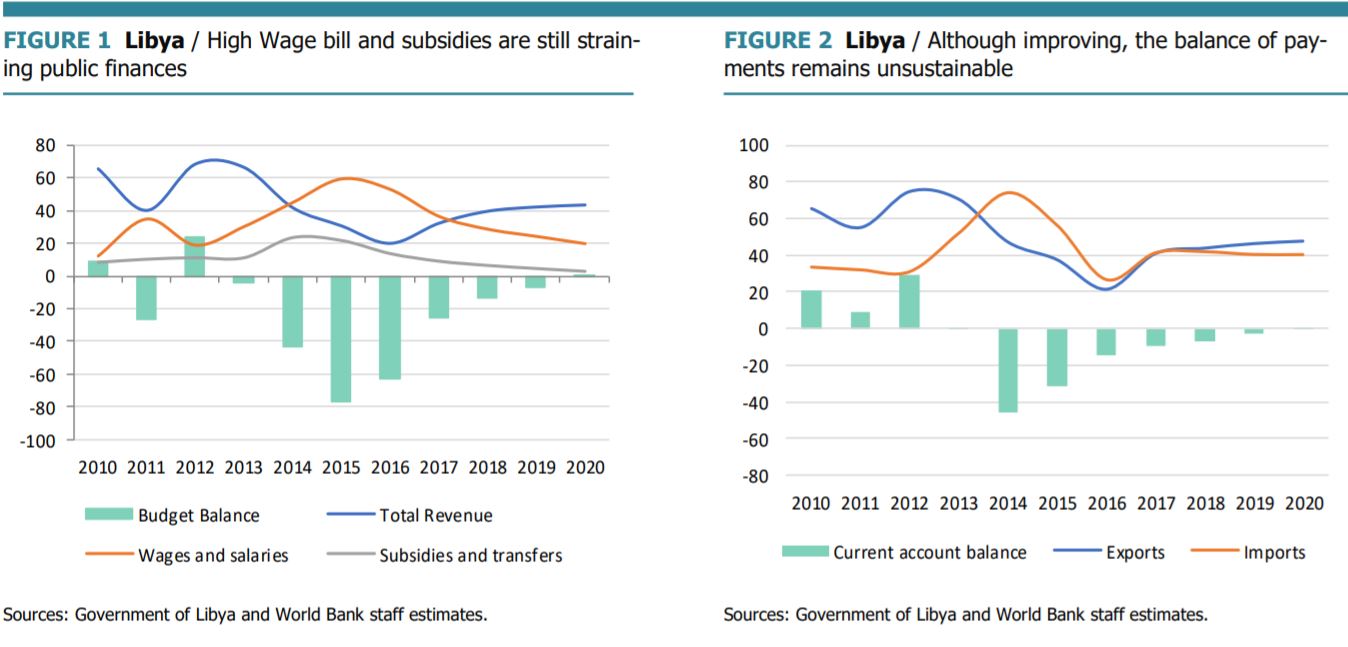 Outlook At the current pace of spending in a context of conflict and insecurity, Libya will either exhaust foreign exchange reserves or be forced into ad hoc adjustments necessary to stave off crisis, but far from sufficient to reestablish growth foundations. The economic and social outlook assumes that political strife is resolved and a unified government can ensure macro stability and launch a comprehensive program to rebuild the economic and social infrastructures. In this context, it is expected that oil production will progressively increase to reach its potential (around 1.5 million bpd) by 2020, which is the time necessary to restore the heavily damaged oil infrastructure. Growth is projected to rebound at around 15 percent in 2018 and an average 7.6 percent in 2019 -20. Both the fiscal and current account balances will significantly improve, with the budget and the current account running surpluses expected from 2020 onwards. Foreign reserves will start building up by 2020. They will average US$72.5 billion during 2018-2020, representing the equivalent of 27.5 months of imports. Risks and challenges The baseline macroeconomic scenario presented above is very fragile because it requires upholding the implicit agreement between the parties in conflict to ensure minimum security around oil infrastructure. Moreover, an improved macroeconomic outlook is unlikely to be sustained and is not sufficient to bring about significant change, unless immediate and targeted actions are taken to address the humanitarian crisis. The country needs humanitarian aid and specific programs to address the destruction and lack of basic services that a large part of the population faces. Immediate challenges are to restore peace that would lead to macroeconomic stability and to improve basic public services. This calls for immediate actions to bring current expenditures under control, especially the wage bill and subsidies, and improve governance of the financial sector, which will also contribute to price stability. Over the medium term, the country needs broader and deeper structural reforms to stabilize the macroeconomic framework and promote private sector-led job generation. Other medium term priorities should focus on promoting the development and diversification of the private sector for job creation through policies to reorient the economy away from hydrocarbon dependence, reforming the financial sector, and improving the business environment. Libya’s economic fragility has important consequences for the people’s well-being. Although there is no systematic study on poverty and very little evidence on the current well-being of Libyan households, it is not unrealistic to think that for most of Libyans living conditions are dire. Since hydrocarbons account for a large share of GDP and government revenues (40 and 86 percent respectively), the sharp decline in oil exports started in 2011 has severely impacted public services. The erratic power supply and the recurrent food shortages also contribute to worsening conditions for people. In the current situation, large share of the population is either vulnerable to poverty or has fallen into poverty. Source: World Bank
0 Comments
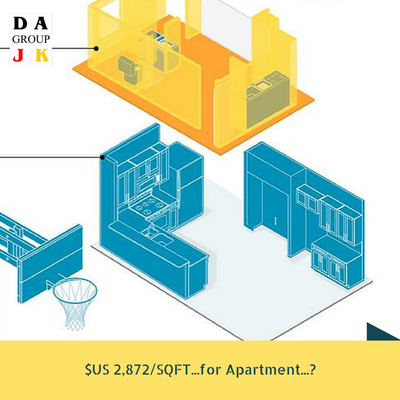
 Know your tenant’s company profile and its ratings before you decide to invest (Tenant is who pays and guarantees the lease for you) One of our criteria selections for net lease commercial real estate investment (NNN CRE) is to select the right tenant very carefully according to their rating. In fact, it is also one of our required selections to mitigate our capital risk. Our typical selected tenant is Dollar General, you can find out this company profile as follow: Dollar General Corporation is a United States chain of variety stores headquartered in Goodlettsville, Tennessee. Dollar General Corporation is an American chain of variety stores headquartered in Goodlettsville, Tennessee. As of August 2017, Dollar General operated over 13,000 stores in all U.S. states except: Alaska, Hawaii, Idaho, Montana, Washington, and Wyoming. The company first began in 1939 as a family-owned business called J.L. Turner and Son in Scottsville, Kentucky by James Luther Turner and Cal Turner. In 1968 the name changed to Dollar General Corporation and the company went public on the New York Stock Exchange. Fortune 500 recognized Dollar General in 1999 and in 2017 reached #128. Dollar General has grown to become one of the most profitable stores in the rural United States with revenue reaching around $21 billion in 2017. Formerly called: J.L. Turner and Son Wholesale Type: Public Traded as: NYSE: DG S&P 500 Component Industry: Discount retailer Founded: 1939 in Scottsville, KY Founders
Number of locations: 14,000 stores (October 2017) Areas served: Contiguous United States except for the Northwest Key people:
Revenue: Increase $20.369 billion (2015) Operating income: Increase$1.940 billion (2015) Net income: Increase$1.165 billion (2015) Total assets: Increase$11.258 billion (2015) Divisions: Dollar General Market Subsidiaries:
Website: www.dollargeneral.com 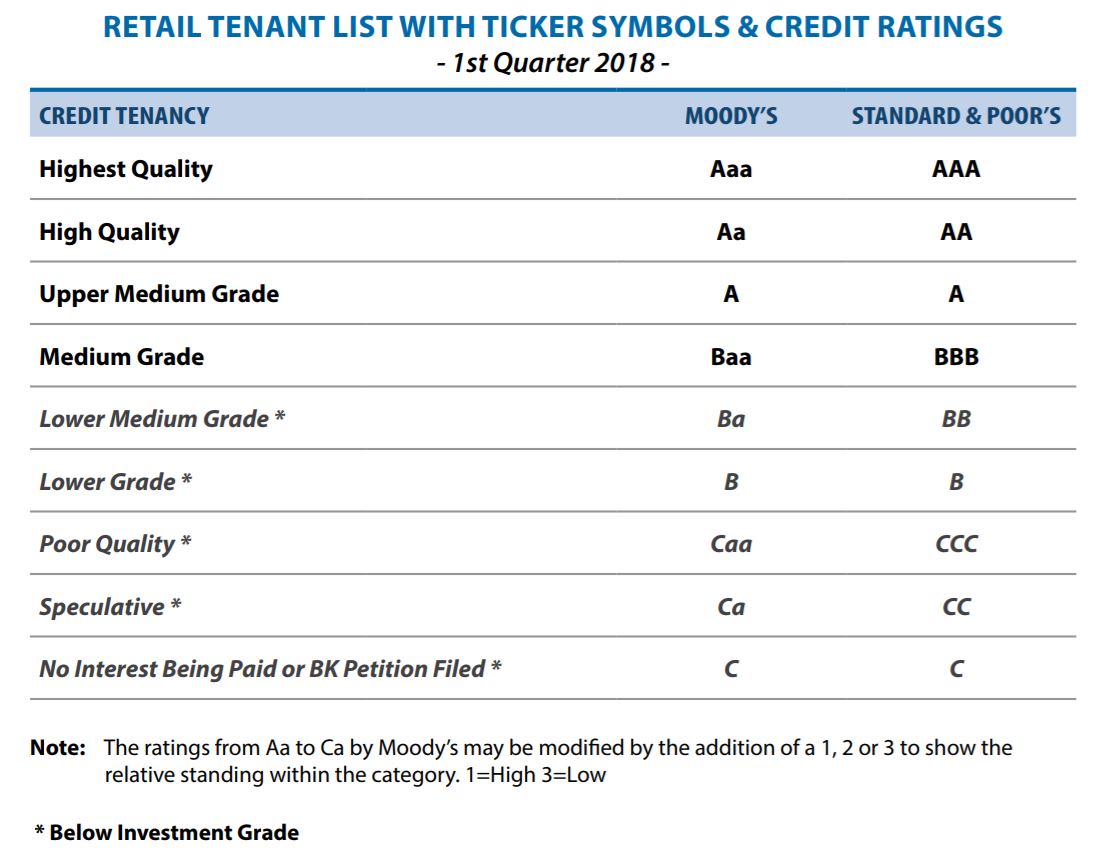 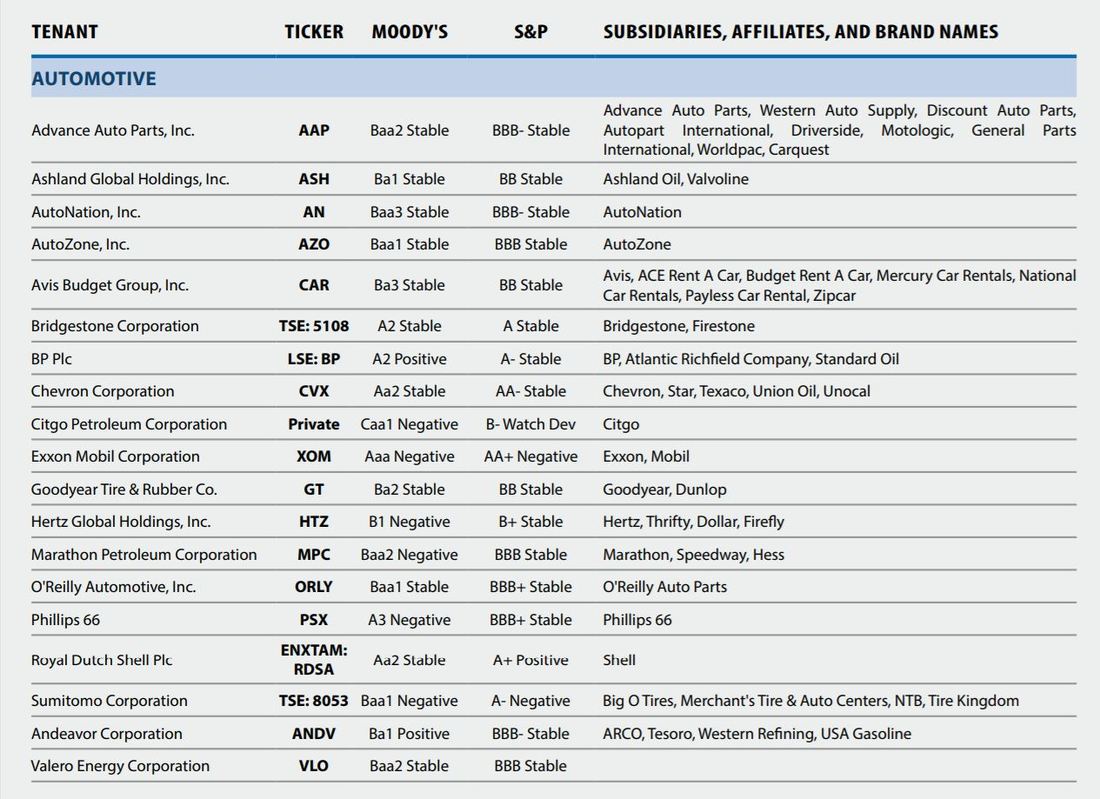 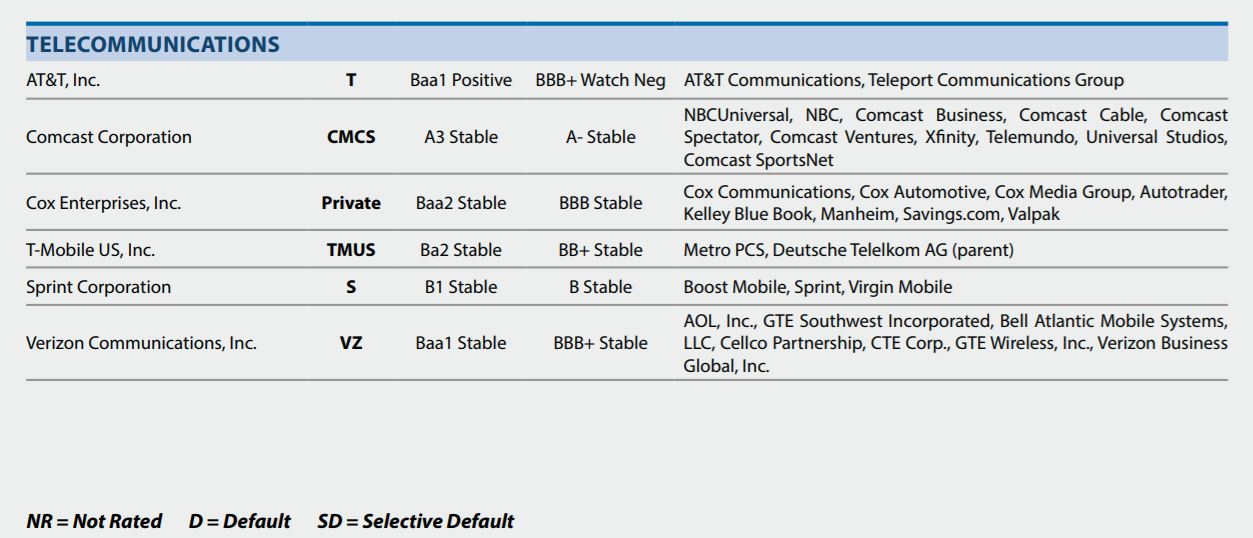 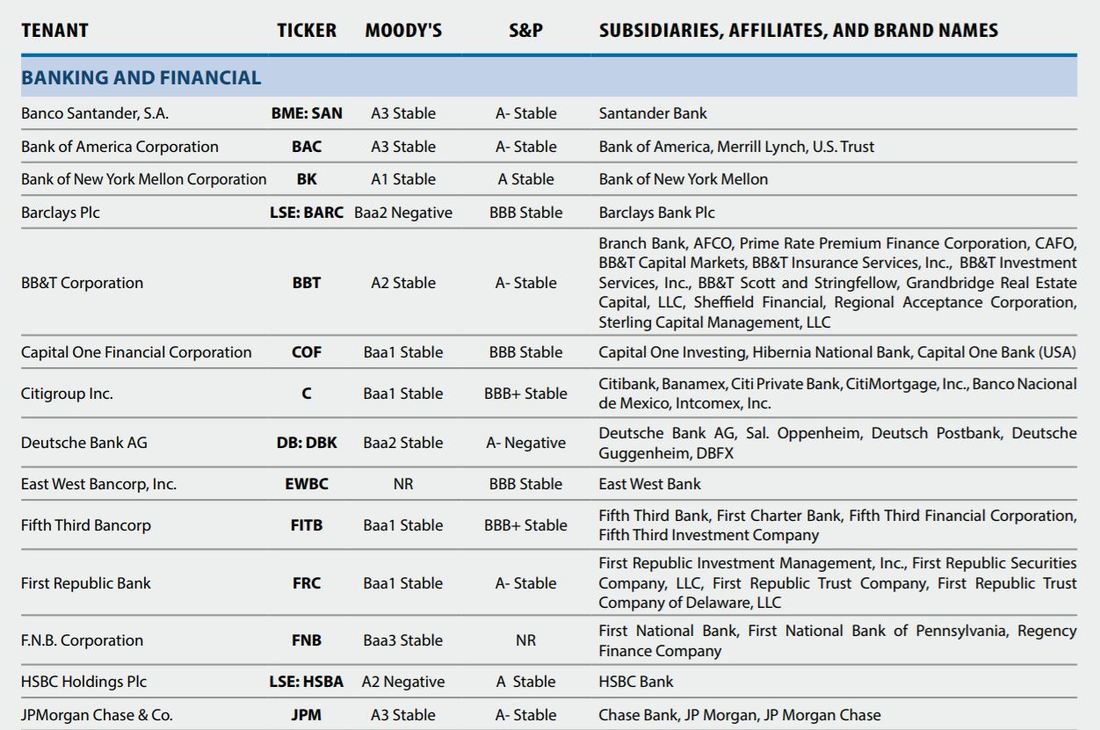 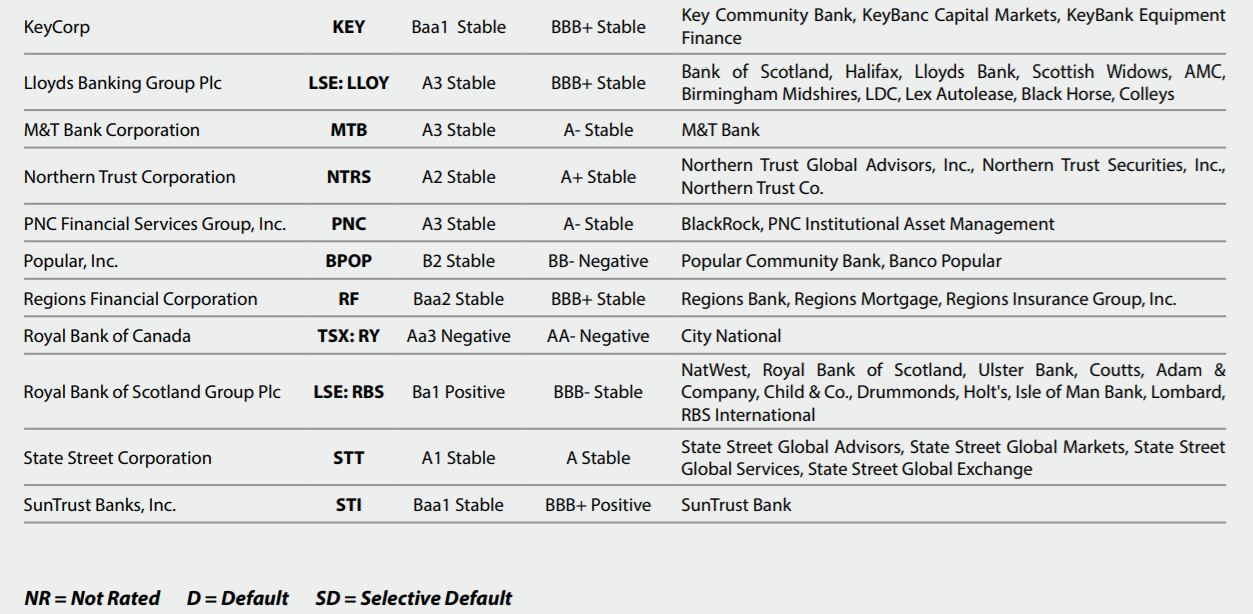 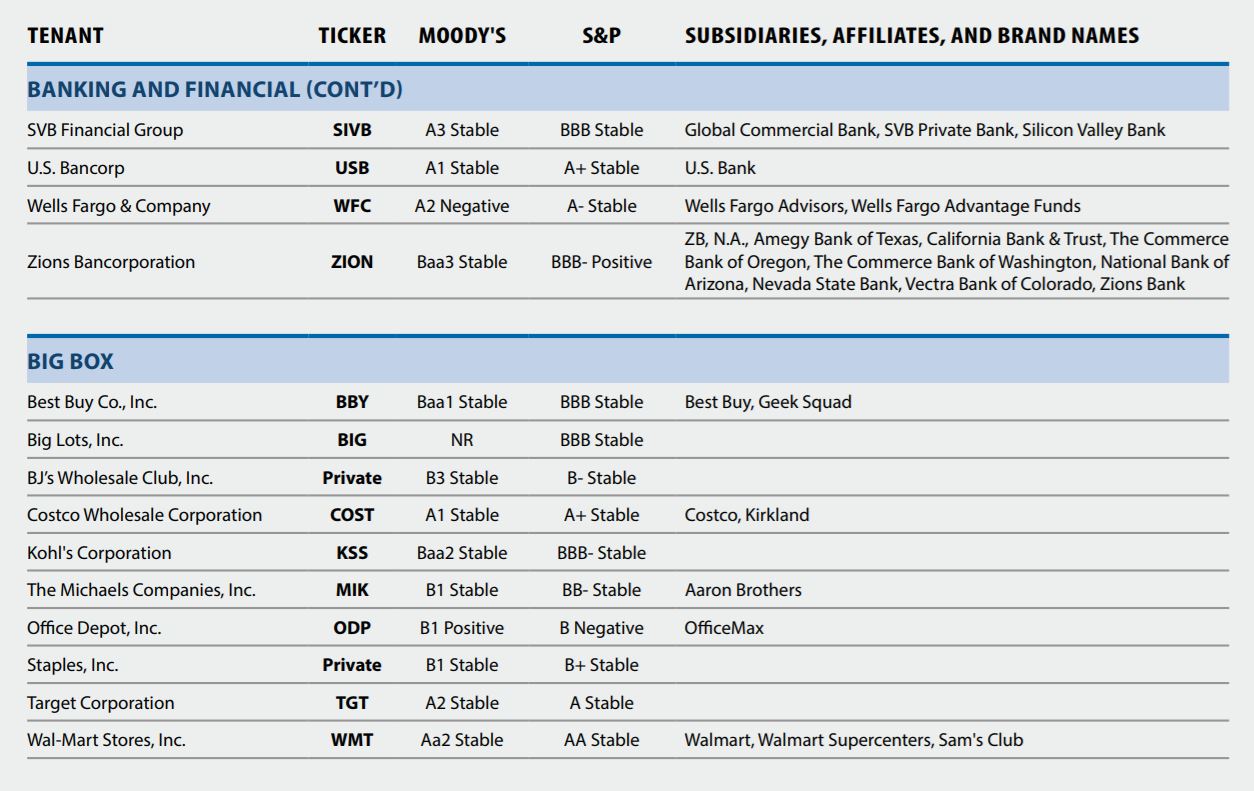 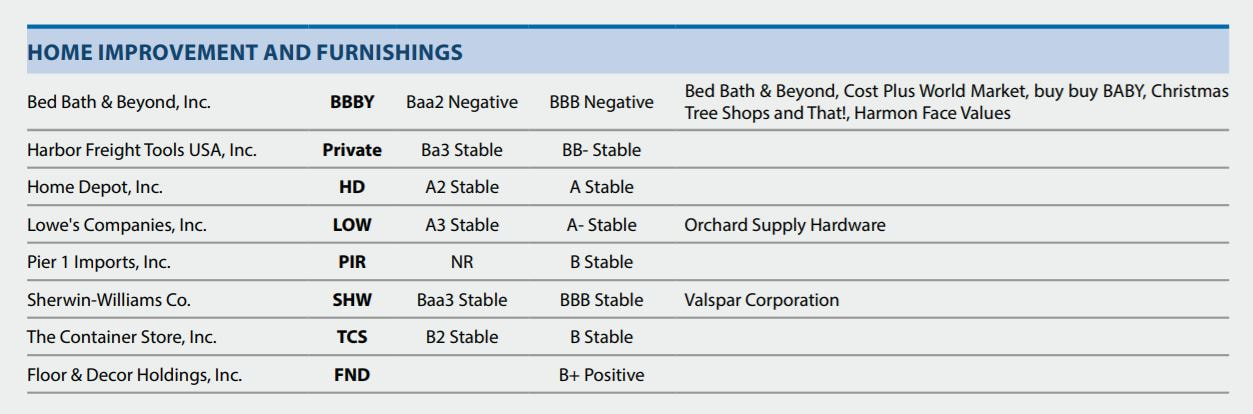 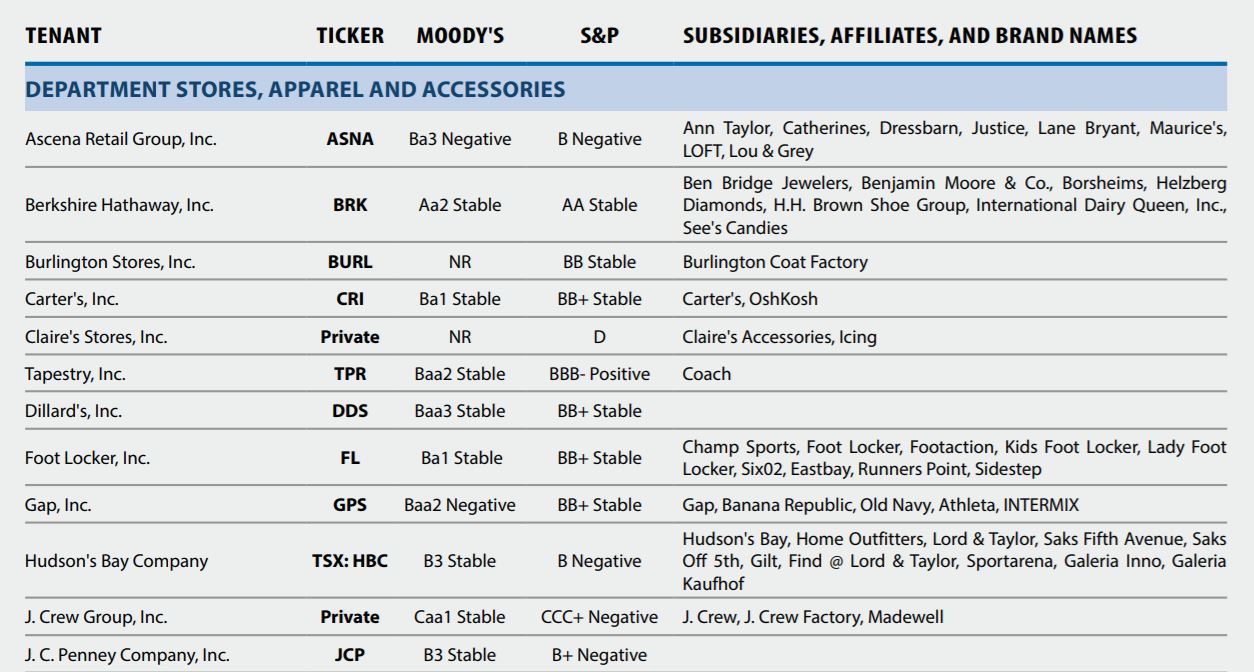 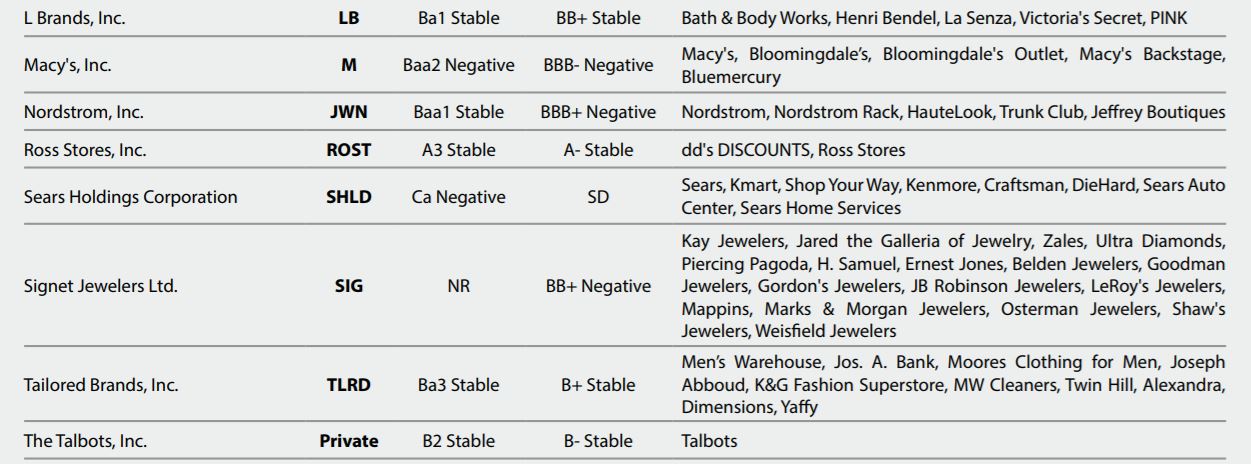 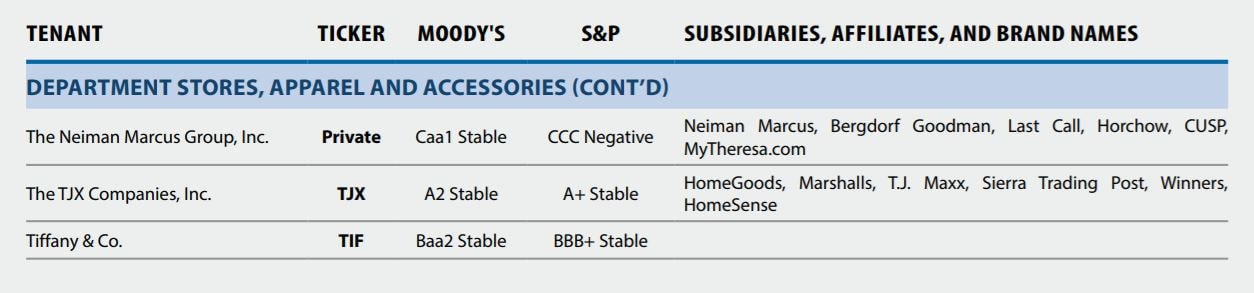 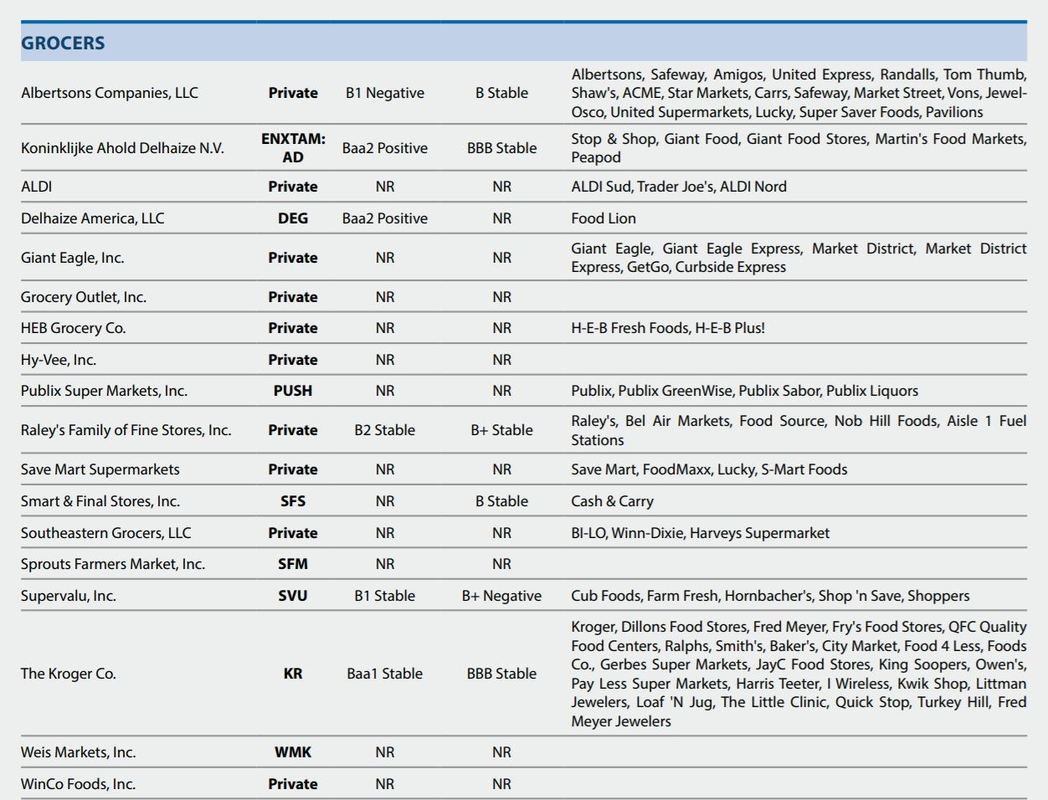 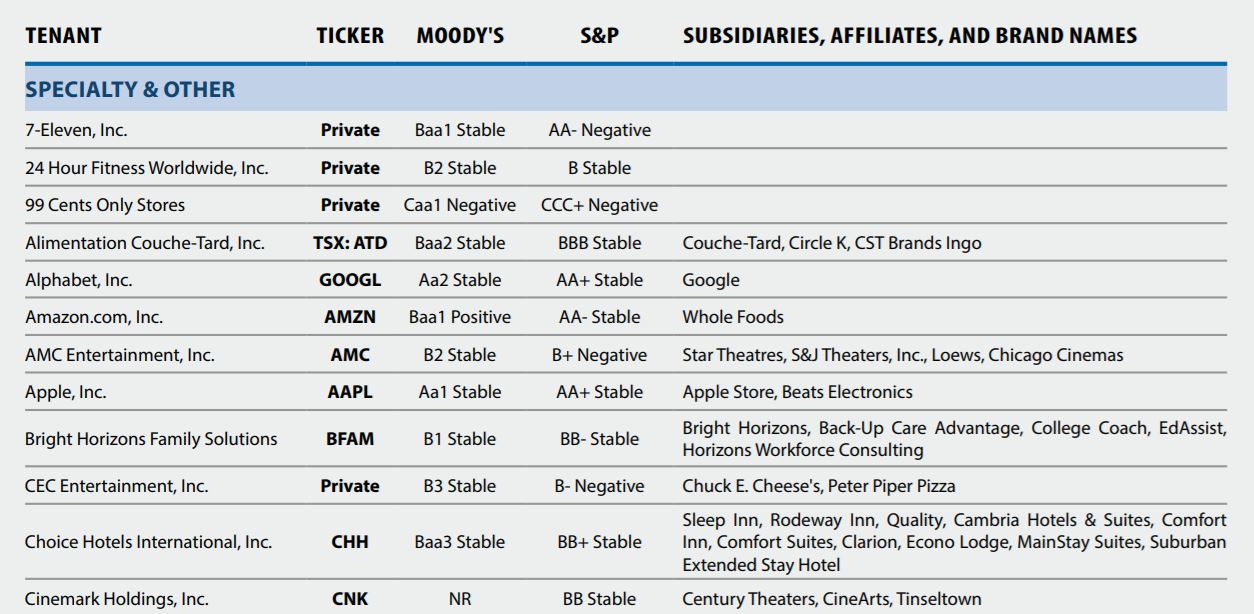 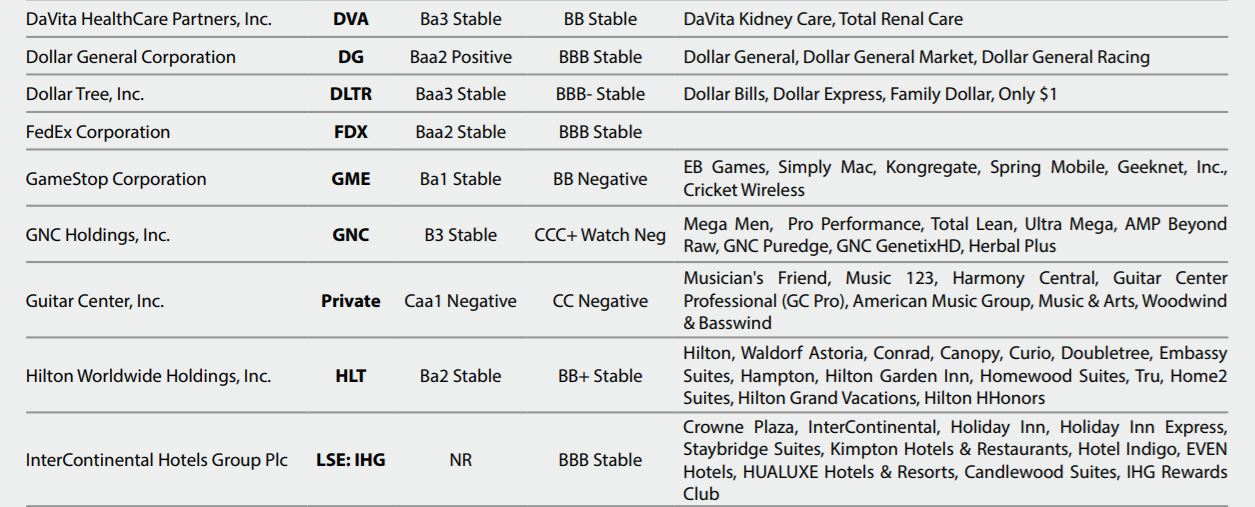 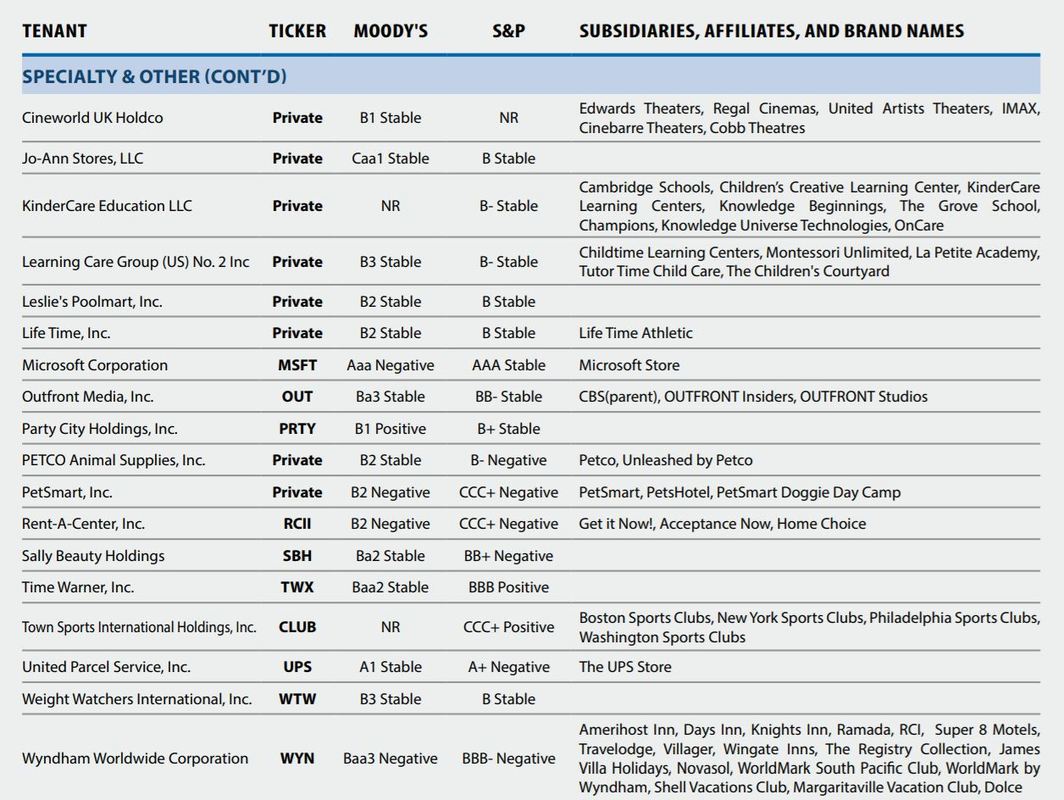 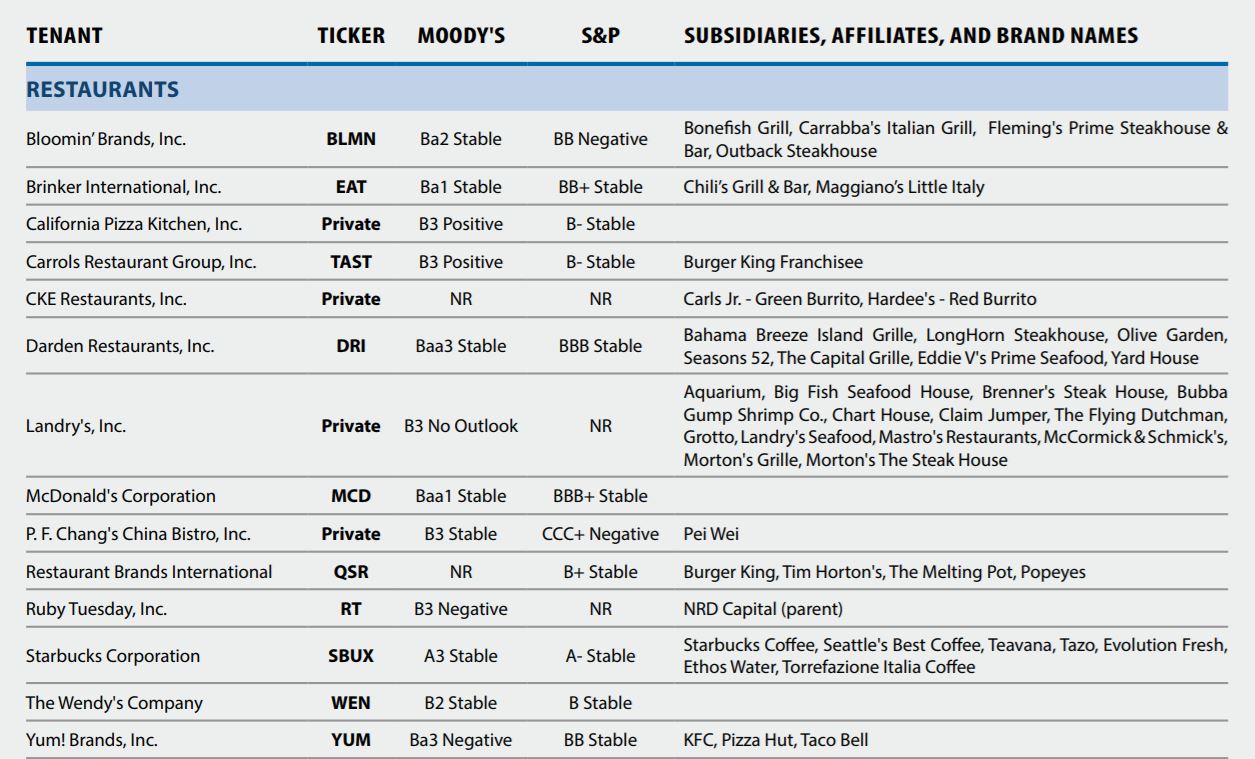 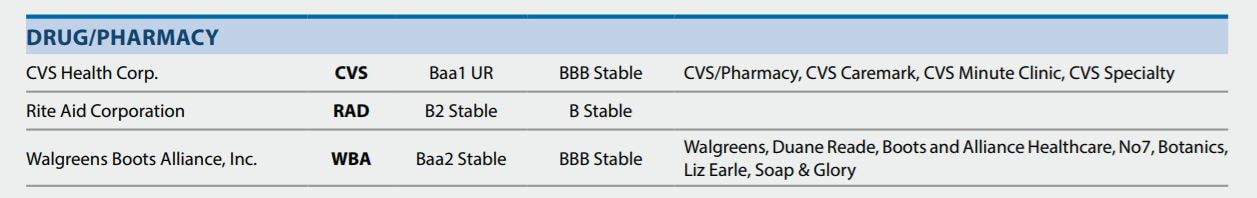 This data is for general information purposes only. DAJK cannot be held responsible for the accuracy of this information. All parties should verify details and ratings independently. If you would like to invest in net lease commercial real estate (NNN CRE), please contact us. If you do not see what you like, please send me your ‘wish list’ with specific investment criteria, we will locate and match your investment wish list. If you would like to learn more how to invest in net lease commercial real estate in USA, you can discover more at NNN CRE USA. PROCEDURE: When you select what NNN CRE(s) you are interested, please send me your Letter of Intent (“LOI”) and Proof of fund (“POF”) to engage the acquisition/investment. The closing time frame is from 30 to 90 days at this point if the Seller accepts our offer. The escrow instructions will be provided for wiring of your investment funds once the Sale and Purchase Agreement is executed. Please note your POF can be a Bank Comfort Letter (“BCL”) from Tier 1 bank or a copy of your deposit with First American Title. Please note our escrow service is with First American Title, Website: http://www.firstam.com/title/commercial/about/index.html
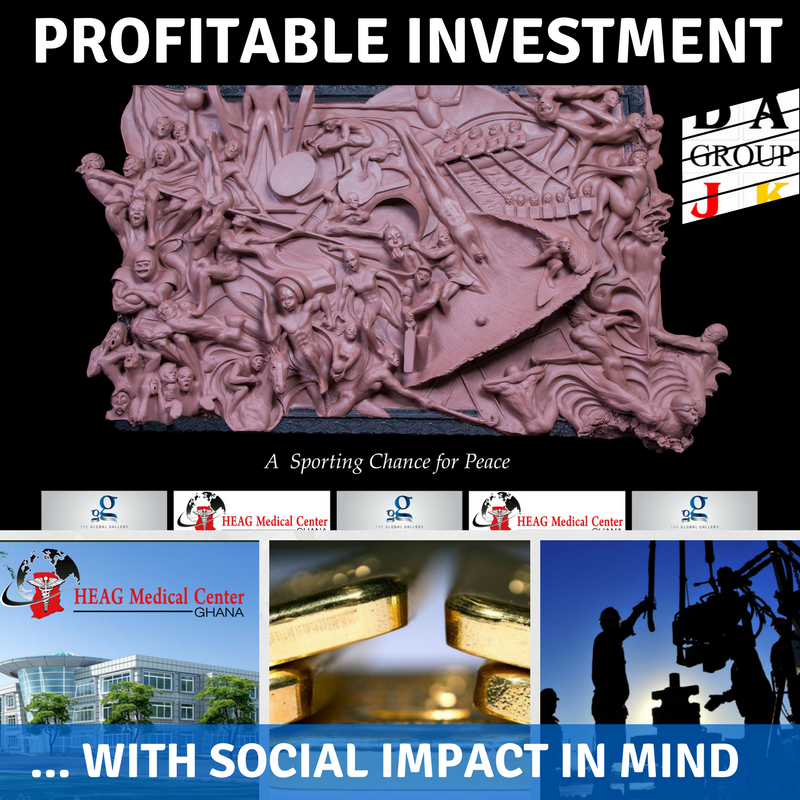
 The London Bullion Market Exchange’s latest Precious Metals Forecast Survey has split analysts on the likely direction of precious metals in 2018. The annual forecast brings together a group of experts to predict the high, low and average price of gold, silver, platinum and palladium during each 12-month period. This year 34 participants were asked for their views. Notable factors that divided the group’s projections included the level of U.S. real interest rates, the likely impact of geopolitical factors and the pace of global economic growth. For gold, the different opinions prompted forecasts in a trading range of US$390 – from a low of US$1,120 per ounce to a high of US$1,510 per ounce. With similar divergences in the other estimates, including a silver low of US$14 rising to a high of US$23, the LBMA said we could be in for “a dramatic year in precious metals”. The extremes at either end of the forecast, however, effectively cancelled each other out with average price predictions for each metal in 2018 little different from those actually seen in the first half of January. If the combined wisdom plays out, the average price of gold across 2018 would be US$1,318, with silver averaging at US$17.81. In the 2017 forecast survey analysts predicted that the average gold price for the year would be US$1,244. As it transpired, they were just 1% out with actual average price of US$1,257. 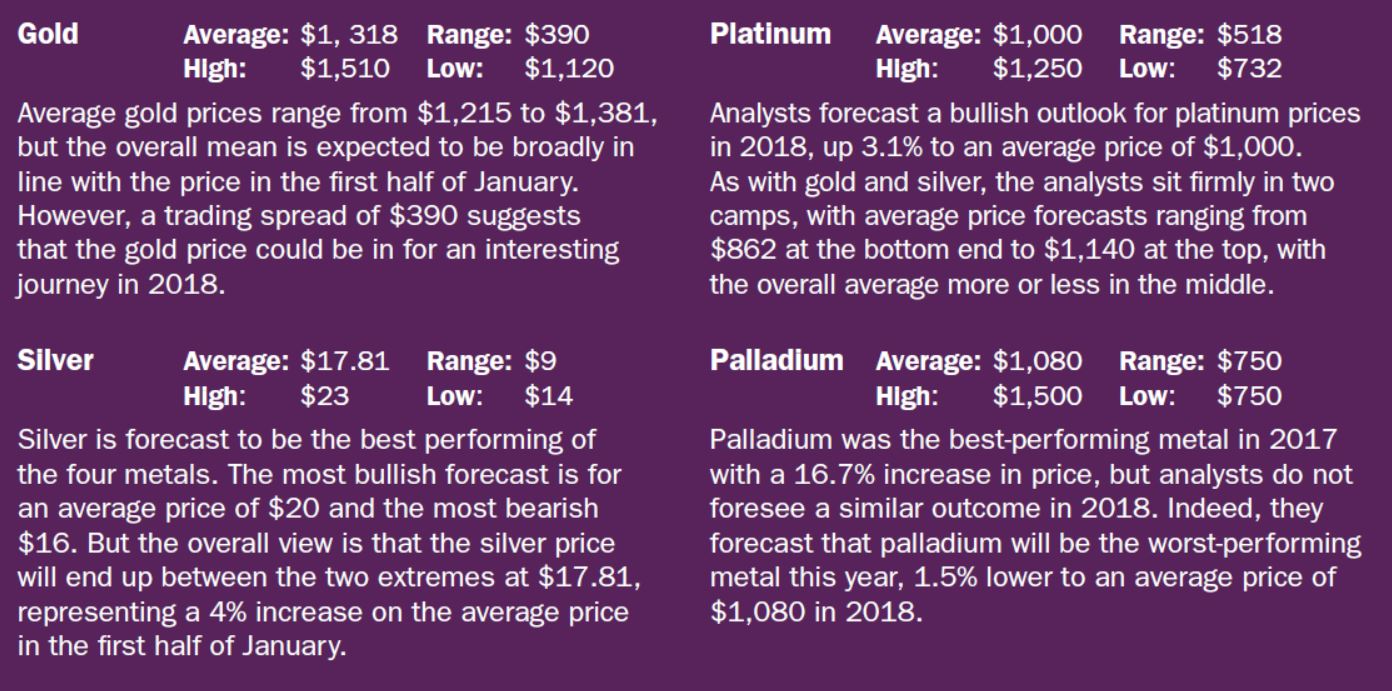 The full survey and what the individual analysts had to say about precious metals prices in 2018 will be available upon your request. Please contact us for the full survey.
 The firms that make clients the happiest face a challenge in getting millennials to stick with them. That's the key takeaway from J.D. Power's 2018 U.S. Full Service Investor Satisfaction Study. The survey also identified out what hard-to-please millennials are going to demand as they come to dominate the marketplace — lots of personal interaction, not just high-tech tools. Financial firms were ranked based on a December survey of 4,419 investors who work with financial advisers for at least some of their investments. Firms were measured on a 1,000-point scale based on how they fared in categories including account information, investment performance, firm interaction, product offerings, commissions and fees, information resources and problem resolution. No. 10: Northwestern MutualScore: 839 With a score that came in precisely at the average of all firms, Northwestern Mutual made it to the Top 10. If it's any consolation, the firm's score was higher than the 838 that won Schwab top honors last year. The Northwestern Mutual is an American financial services mutual organization based in Milwaukee. The financial security company provides consultation on wealth and asset income protection, education planning, retirement planning, investment advisory services, trust and private client services, estate planning and business planning. Its products include life insurance, disability income, and long-term care insurance; annuities; investments; and investment advisory products and services. Type Private (Mutual) Industry Financial Services Founded 1857 Headquarters Milwaukee, Wisconsin Key people John Schlifske, chairman and CEO, Greg Oberland, president Products Insurance and investments Revenue Increase$28.158 billion USD (2016)[1] Net income Increase $818 million USD (2016) Number of employees 7,500 (2017) Website www.northwesternmutual.com No. 9: Raymond JamesScore: 842 The firm slipped from eighth place in last year's survey, but its satisfaction score was much higher than the 819 it posted last year. Raymond James Financial is an American diversified holding company providing financial services to individuals, corporations and municipalities through its subsidiary companies that engage primarily in investment and financial planning, in addition to investment banking and asset management. Type Public Traded as NYSE: RJF S&P 500 Component Industry Investment services Founded 1962; 56 years ago Founder Robert James Headquarters St. Petersburg, Florida, United States Key people Tom James (Chairman Emeritus) Paul Reilly (Chairman and CEO) Products Financial services, securities and insurance brokerage, investment banking, asset management, banking and cash management, trust services. Revenue Increase 6.37 billion USD (2017) Net income Increase $636.3 million USD (2017) Website www.raymondjames.com Nos. 8, 7 and 6: UBS, LPL and FidelityScores: 851 The three-way tie belies some key differences from last year. UBS, for instance, fell from fifth place last year, but its score rose from 827. Fidelity fell from its No. 2 position last year, but its score also rose — from 835. And last year, LPL wasn't among the Top 10. No. 5: Merrill Lynch Score: 852 The giant moved up sharply from ninth place last year, and its satisfaction score jumped from 819. Merrill Lynch Wealth Management is a wealth management division of Bank of America. The firm is headquartered in New York City, and occupies the entire 34 stories of 250 Vesey Street, part of the Brookfield Place complex, in Manhattan. Merrill Lynch employs over 15,000 financial advisors and manages $2.2 trillion in client assets. The firm has its origins in Merrill Lynch & Co., Inc. which, prior to 2009, was publicly owned and traded on the New York Stock Exchange under the ticker symbol MER. Merrill Lynch & Co. agreed to be acquired by Bank of America on September 14, 2008, at the height of the 2008 Financial Crisis.[5] The acquisition was completed in January 2009[6] and Merrill Lynch & Co., Inc. was merged into Bank of America Corporation in October 2013, although certain Bank of America subsidiaries continue to carry the Merrill Lynch name, including the broker-dealer Merrill Lynch, Pierce, Fenner & Smith. No. 4: RBC Wealth ManagementScore: 863 RBC is another instance of a firm making the Top 10 list this year after having a less-than-stellar ranking in 2017. For more than a century, RBC Wealth Management has provided trusted advice and wealth management solutions to individuals, families and institutions. We are a global organization, bringing our diverse expertise and deep knowledge to the sophisticated financial needs of our clients around the world. We are committed to earning our client’s trust by building lasting relationships and confidence, putting your interests first in everything we do. Every interaction with us is defined through our core values and culture of doing what’s right for our clients and the communities we operate in. Forward-looking, innovative and committed helping our clients thrive and communities prosper – we are the partner you can depend on to help you achieve your financial goals. No. 3: Stifel Nicolau Score: 865 The firm improved its leadership position, moving up from last year's sixth spot and its 2017 score of 826. Stifel Financial Corp. (NYSE: SF) is a financial services holding company created under its present name in July 1983 and listed on the New York Stock Exchange on November 24, 1986. Its predecessor company was founded in 1890 as the Altheimer and Rawlings Investment Company and is headquartered in downtown St. Louis, Missouri. Stifel offers securities-related financial services in the United States and Europe through several wholly owned subsidiaries. Its clients are served through Stifel, Nicolaus & Company, Incorporated (Stifel Nicolaus) in the U.S., a full-service retail and institutional brokerage and investment banking firm, through Stifel Nicolaus Canada Inc. in Canada, and through Stifel Nicolaus Europe Limited (SNEL) in the United Kingdom and Europe. Its other subsidiaries include Thomas Weisel Partners LLC (TWP), Century Securities Associates, Inc. (CSA), an independent contractor broker-dealer firm, and Stifel Bank & Trust, a retail and commercial bank. The company's broker-dealer affiliates provide securities brokerage, trading, investment banking, investment advisory, and related financial services to individual investors, professional money managers, businesses, and municipalities. Stifel Bank & Trust offers a full range of consumer and commercial lending solutions. Stifel Trust Company, N.A. offers trust and related services. Type Public Traded as NYSE: SF S&P 400 Component Industry Investment services Founded 1890; 128 years ago Headquarters St. Louis, Missouri, U.S. Key people Ronald J. Kruszewski (Chairman of the Board, President, and CEO) Products
Revenue US$ 2.2 billion (2014) No. of employees 5,266 (2012) Website www.stifel.com No. 2: Edward JonesScore: 866 The St. Louis-based giant inched up from the No. 3 spot last year and improved its satisfaction score from 833. Edward D. Jones & Co., L.P., since 1995 simplified as Edward Jones is a financial services firm headquartered in Des Peres, Missouri, United States and serves investment clients in the U.S. and Canada, through its branch network of more than 14,000 locations and currently have relationships with nearly 7 million clients and $1 trillion asset under management worldwide. The firm focuses solely on individual investors and small-business owners. Edward Jones is a subsidiary of The Jones Financial Companies, L.L.L.P., a limited liability limited partnership owned only by its employees and retired employees and is not publicly traded. Type Partnership Industry Investment services Founded 1922 Founder Edward D. Jones Headquarters Des Peres, Missouri, United States Revenue US$6.632 billion (2016) Net income US$746 million (2016) Total assets US$19.424 billion (2016) Number of employees 43,000 (2016) Parent The Jones Financial Companies Website www.edwardjones.com No. 1: Charles SchwabScore: 867 Schwab not only retained the lead position that it held last year, it also increased its customer satisfaction from a score of 838. The Charles Schwab Corporation is a bank and brokerage firm, based in San Francisco, California. It was founded in 1971 by Charles R. Schwab and is one of the largest banks in the United States and is one of the largest brokerage firms in the United States. The company provides services for individuals and institutions that are investing online. The company offers an electronic trading platform for the purchase and sale of financial securities including common stocks, preferred stocks, futures contracts, exchange-traded funds, options, mutual funds, and fixed income investments. It also provides margin lending, and cash management services, as well as services through registered investment advisers. Type Public Traded as
Industry Financial services Founded 1971; 47 years ago (as Charles Schwab & Co., Inc.) Founder Charles R. Schwab Headquarters San Francisco, California, U.S. Number of locations 345 branches Key people
Services Brokerage firm Revenue US$8.62 billion (2017) Operating income US$3.65 billion (2017) Net income US$2.35 billion (2017) AUM US$3.36 trillion (2017) Total assets US$243.27 billion (2017) Total equity US$18.53 billion (2017) Number of employees 17,600 (2017) Website Schwab.com
|
AuthorDAJK GROUP is the place where investors, business owners and entrepreneurs can research and find useful information, insight, resources, advice, guidance and inspiration for acquiring funds for their project, acquisition for their net lease commercial real estate, increasing their assets and running their profitable business. Archives
July 2023
Categories |


Services |
Company |
|