DAJK Group
  • About
  • Project Funding
  • Financial Services & Asset Management
  • Net Lease Investment
  • Business Finance & Development
  • Consultant & Concierge Services
  • Investment & Business Resources
  • Products & Gift Ideas
  • GEP Blog
  • GEP Blog2
  • Business Principles
  • Contact

You Will Get Rejected — How You Handle It Will Make You Successful​

Cap Rate Half-Annual Report 2016 for Commercial Real Estate in USA

9/28/2016

0 Comments


Highlights


​•           Central Business District (“CBD” or “Downtown”) Office Sector
•           Suburban office Sector
•           Industrial Sector
•           Retail Sector
•           Multifamily properties Sector
•           Hotel Sector


Picture
For all property types, little to no change is anticipated over the next six months in more than 60% of the markets. In markets where change is anticipated, cap rates are more likely to increase rather than decrease.  
​

Central Business District (“CBD” or “Downtown”) Office

​Cap rates edged upward for all CBD office classes and tiers in H1 2016 with the exception of Tier II and III Class AA properties. Overall, the increases for both stabilized and value-add acquisitions were generally modest at 7 and 10 bps, respectively.
​

Suburban office

Suburban office cap rates for stabilized assets and expected returns on cost for value-add acquisitions increased across all classes and, in most cases by a greater amount than those for CBD properties. Stabilized cap rates rose 15 bps, while value-add expected returns on cost increased 12 bps.
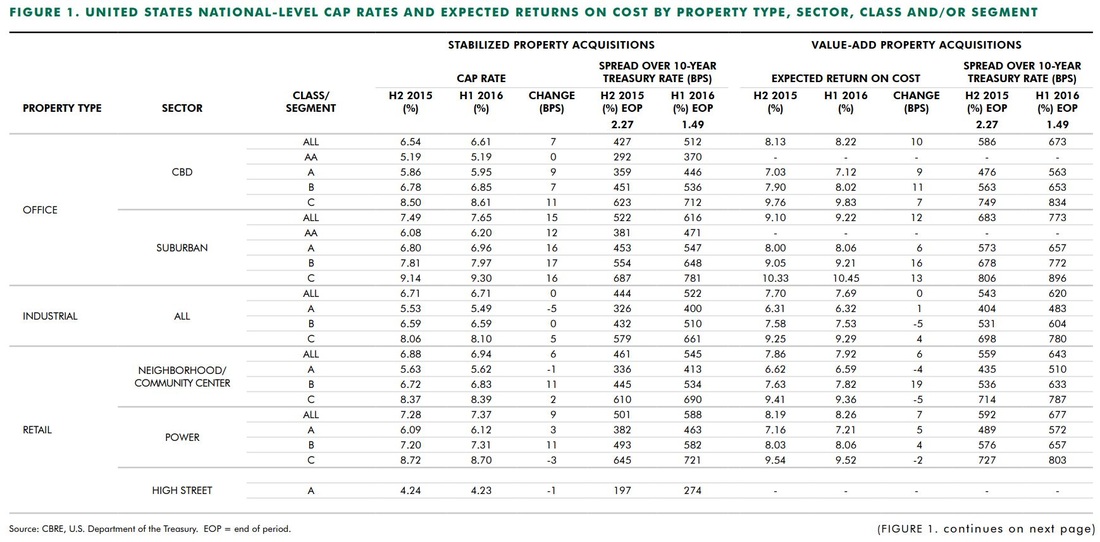
​
Picture

Industrial Sector

Industrial cap rates were essentially flat for acquisitions of stabilized assets in H1 2016. The overall rate was 6.71%. Cap rates for stabilized Class A industrial space dropped 5 bps to 5.49%; Class B remained flat at 6.59%; and Class C increased 7 bps to 8.10%. The expected return on cost for value-add assets was stable at 7.69%.
​

Retail Sector

Cap rates in the retail sector were relatively stable in H1 2016. A slow-down in cap rate compression among prime assets suggests that they may have reached a cyclical low in 2015. Meanwhile, modest cap rate expansion for Class B properties in both the neighborhood/community and power center segments signals investor concern about the future of non-prime assets in increasingly competitive retail markets.

​

Multifamily properties

Multifamily properties have the lowest overall cap rates of any major sector at 5.26% for stabilized infill and 5.67% for stabilized suburban assets.

The H1 2016 survey revealed virtually unchanged cap rate conditions for stabilized infill and suburban multifamily acquisitions. The only notable movement of cap rates for stabilized assets was slightly downward in both infill and suburban Tier III rates, and in Class C suburban cap rates. Investors are still moving out the risk curve in terms of location and product, and still find value add assets very attractive.
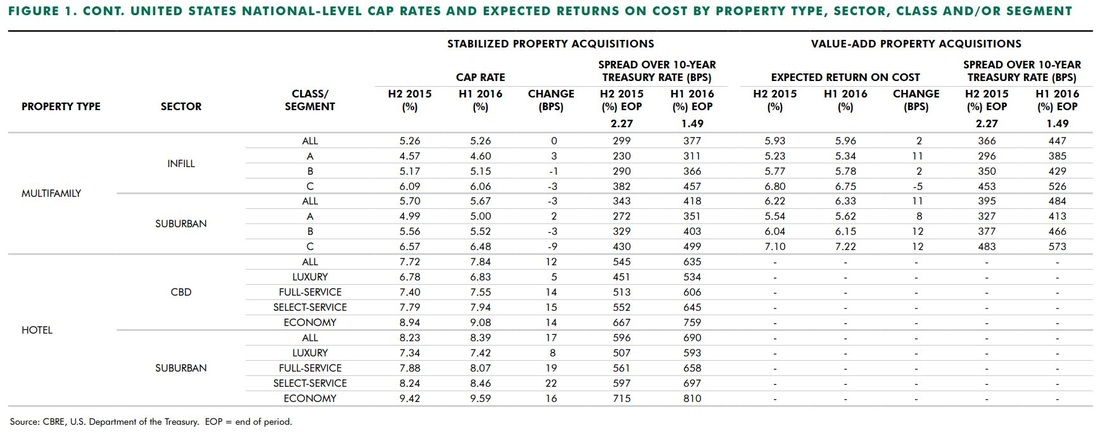
​
Picture

Hotel Sector

The upward shift of hotel cap rates that began in H1 2015 continued in the first half of 2016, with rates rising across most categories. Movements in hotel cap rates among most CBD and suburban property types showed minimal changes.  Low barrier-to-entry hotel categories, such as economy and select-service, experienced slightly larger increases.

Hotels recorded the highest increases in cap rates of any property sector. Cap rates for CBD hotels rose modestly from 5 to 15 bps, while those for suburban hotels rose 8 to 22 bps.
​
​For all property types, little to no change is anticipated over the next six months in more than 60% of the markets. In markets where change is anticipated, cap rates are more likely to increase rather than decrease.  Approximately 20% of markets may experience increases of up to 25 bps, versus only 10% of markets that may experience decreases. Less than 5% of markets are likely to experience movement greater than 25 bps in either direction.
 
Source:  CBRE H1 Report

[Discover more...]

30-minutes Free Confidential Consultation

If you need further clarifications or interest with net lease commercial real estate investment, please sign-up for our 30-minute Free Confidential Consultation.

0 Comments

Crude Oil Market Updates 9172016

9/17/2016

0 Comments

 
  • Why the U.S. is a major roadblock for oil output freeze
  • Libya Resuming Oil Exports From Some Major Ports
  • Record Oil Demand Buffers One Corner of Shipping
  • Annual Energy Outlook 2016 Report with Projection to 2040
​

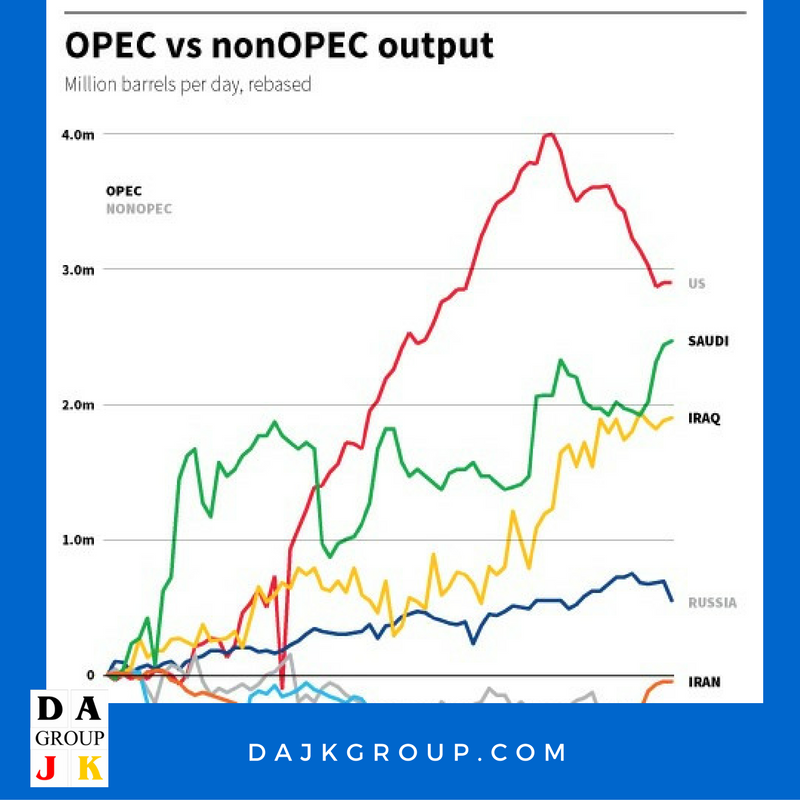
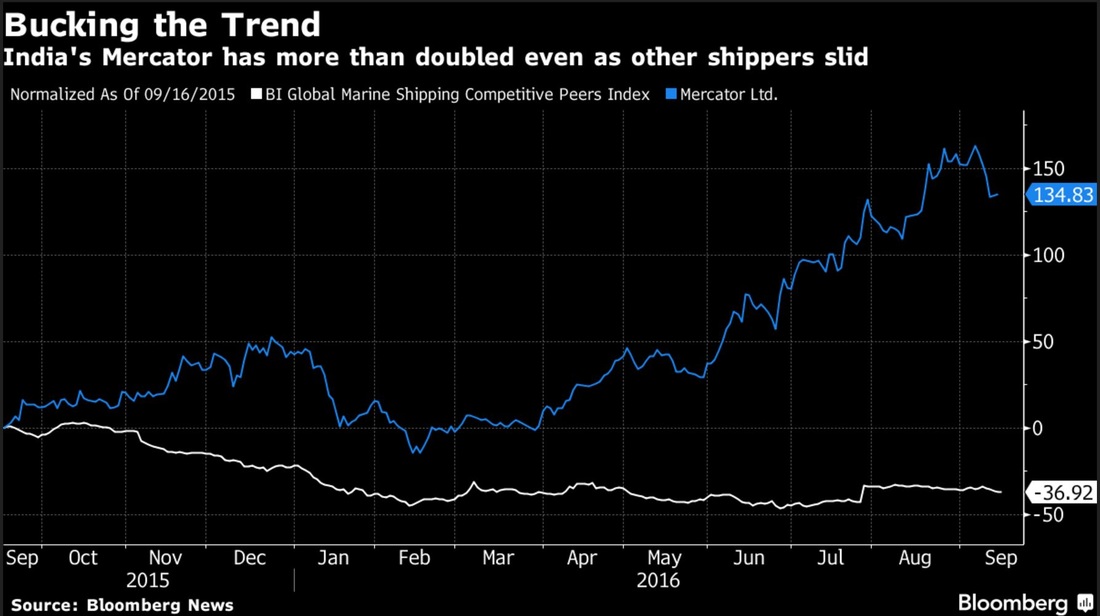
Why the U.S. Is a Major Roadblock For Oil Output Freeze
​

The U.S., especially now that it can export crude, is a global threat to market share, it’s not just a threat indirectly through product exports any more
Picture

The price of oil has been caught in one of its most volatile couple of weeks in months after OPEC and rival Russia hinted they may discuss a possible output freeze, as demand slows and a global surplus becomes more entrenched. The Organization of the Petroleum Exporting Countries and Russia meet on the sidelines of the International Energy Forum in Algiers in two weeks’ time. The pressure is mounting on both sides to not only freeze output, but possibly even cut it.  Whatever the rival factions decide, one producer has managed to top them all in terms of production growth over the last five years and will never be likely to join in any group efforts to control supply. And that is the United States.

Since 2010, thanks to the boom in shale oil production, the United States has witnessed more growth in daily output than any other major producer.

U.S. oil output is around 2.87 million barrels per day higher now than it was six years ago, compared with an increase of 2.47 million bpd from Saudi Arabia and a rise of 1.9 million bpd from Iraq.

In fact, the increase in U.S. production is only just above the collective increase for the whole of OPEC, which comes in at around 3.15 million bpd.

"If OPEC were to cut its production in Algiers, or really freeze its production, then prices would rise, and what producer would benefit the most rapidly from those high prices? It would be the U.S.. We would be back soon enough in a situation where the U.S. will move toward its previous boom-rate of growth and therefore start absorbing market share again," Wood Mackenzie analyst Ann-Louise Hittle said.

"It’s another reason why it's difficult for OPEC to agree to a freeze" she said. "The U.S., especially now that it can export crude, is a global threat to market share, it’s not just a threat indirectly through product exports any more."

In November 2014, OPEC ditched its policy of restraining supply to support the price of oil, which has fallen by more than 40 percent since then to around $46 a barrel LCOc1.
​
Increases in the likes of Saudi Arabia or Iraq have been countered by losses in Libya and Nigeria or Venezuela, while Iran is just about approaching output levels registered prior to the introduction of Western sanctions in response to Tehran's nuclear program that were lifted in January 2016.
 

Libya Resuming Oil Exports From Some Major Ports
​

Libya is resuming oil exports from some of its main ports which forces loyal to eastern commander Khalifa Haftar seized in recent days and has lifted related “force majeuere” contractual clauses, the National Oil Corporation said on Thursday. The north African nation is highly dependent on hydrocarbon revenues and needs oil exports to resume to save its economy from collapse. Conflict since Libya’s 2011 uprising has reduced its oil output to a fraction of the 1.6 million barrels per day the OPEC member once produced. “Exports will resume immediately from Zueitina and Ras Lanuf, and will continue at Brega … exports will resume from Es Sider as soon as possible,” NOC Chairman Mustafa Sanalla said.

He said Libya's U.N.-backed government in Tripoli and a parliament based in eastern Libya both backed reopening the ports which have been controlled by forces loyal to Haftar since Sept 11-12.
Haftar has been an outspoken opponent of the Government of National Accord (GNA) in Tripoli, and his seizure of the four ports from a rival force aligned with the GNA had raised fears of fresh conflict over Libya's oil resources.

"NOC is in charge of the ports," Sanalla said on Thursday, a day after visiting Zueitina. "They are secure, and we have been in contact with our foreign commercial partners."
A Reuters reporter at Zueitina saw large numbers of military vehicles and men belonging to a guard force allied to Haftar's Libyan National Army (LNA).

Western powers had condemned Haftar's seizure of the ports and had said they were ready to prevent any exports attempted outside the GNA's authority.
"(This) had the potential to escalate, with potentially devastating consequences for the nation and our petroleum industry," Sanalla said.

"Instead, we have found a shared interest in letting the oil flow, and the wisdom of that decision needs to be recognized."

U.S. Libya envoy Jonathan Winer called reports of the LNA handing over control of the ports to the NOC a "promising development", writing on Twitter that increased oil production could have an "immediate positive impact".

Libya could raise output to 600,000 barrels per day (bpd) within a month and to 950,000 by the end of the year from about 290,000 currently, Sanalla said this week, but he said NOC would need new funds and blockaded pipelines in southwest Libya would need to be reopened.

Declaring "force majeuere" allows an oil supplier to break a contract because of circumstances beyond its control.
​

Record Oil Demand Buffers One Corner of Shipping
​

Indian carriers are benefiting from surging oil imports Most of the South Asian nation’s fleet comprises tankers As the shipping industry grapples with a prolonged slump in demand, carriers in India are grateful for the bright spot of record domestic fuel consumption. The nation of 1.3 billion people is expanding at the fastest pace among major economies and is set to import an unprecedented amount of crude oil to fuel growth. That’s helping the tanker-heavy fleets of Shipping Corp. of India Ltd., Great Eastern Shipping Co. and Mercator Ltd., India’s three largest carriers. “Because our energy consumption is so high — with the population and the sheer size of the country — demand will continue to rise,” B. B. Sinha, a director and former chairman of Shipping Corp. of India, said in an interview in Mumbai. Oil and liquefied natural gas offer good opportunities, he added.
​
While a trade slump and industry overcapacity pushed some container lines and bulk carriers to collapse or report losses, the three Indian lines posted profits in the last two fiscal years. Mercator’s shares more than doubled in the past 12 months, bucking a global decline in shipping stocks.
​
Picture

Container shipping companies carry a wide range of goods such as clothes, furniture and bananas, while bulk carriers ship unpacked cargo including coal, cement and grains.

“Idling isn’t a threat to us,” said Atul J. Agarwal, executive vice chairman of Mercator, pointing to a rule that gives domestic carriers first right of refusal in tenders for certain shipments.

Shipping rates tumbled after the 2008 global financial crisis and remain depressed. South Korean container line Hanjin Shipping Co., Japan’s Daiichi Chuo KK and dry-bulk shippers Global Maritime Investments Holdings Cyprus Ltd. and Bulk Invest ASA are among companies to have filed for bankruptcy in the past year or so.
​
Imports account for roughly 80 percent of India’s crude oil needs. The $2 trillion economy is expected to surpass Japan as the world’s third-largest oil user this year, and will be the fastest-growing crude consumer in the world through 2040, International Energy Agency estimates show.

Annual Energy Outlook 2016 Report with Projection to 2040
​


Projections in the Annual Energy Outlook 2016 (AEO2016) focus on the factors expected to shape U.S. energy markets through 2040. The projections provide a basis for examination and discussion of energy market trends and serve as a starting point for analysis of potential changes in U.S. energy policies, rules, and regulations, as well as the potential role of advanced technologies.

Key updates made for the AEO2016 Reference case include the following:

The Annual Energy Outlook 2016 (AEO2016) Reference case included as part of this complete report (released in July 2016) has been updated from the Annual Energy Outlook 2015 Reference case (released in April 2015). The updated Reference case reflects new legislation and regulations enacted since April 2015, model changes, and data updates. The key model and data updates include:

Macroeconomic
  • Updated historical data on industries and employment
  • Updated information on natural gas extraction from the National Energy Modeling System (NEMS)
  • Extended dynamic Input-Output framework from 2013 to 2040
  • Disaggregation of three pulp and paper subindustries included in the NEMS macroeconomic model: pulp and paper mills, paperboard and containers, and all other pulp and paper
  • Disaggregated ethanol, flat glass, and lime and gypsum subindustries in the Industrial Output and Employment Model
  • Incremental electricity investment required to meet the standards in the U.S. Environmental Protection Agency (EPA) Clean Power Plan (CPP) [7]
  • Re-estimated commercial floorspace model, using data from Dodge Data and Analytics, and transformation of floorspace estimates to projected growth rates rather than levels
 
Full e-Report (256 pages) will be email to you once we receive your request.
 

Sources:  Reuters, Bloomberg, EIA

Libyan Crude Oil Buyer Wanted

Picture

Learn more details at Oil Trade page
0 Comments

Independent Global Sales Agents Hiring Annoucement

9/17/2016

0 Comments

 
Sponsored by our strategic partner Decade of Peace

Independent Global Sales Agents Wanted
(Home-based, Part Time, No Initial Capital Required)
 
Global Sales Target of 15,000 Sculptures
Titled ‘A Sporting Chance for Peace’
Open Edition, cast in bronze powder and resin,
Measurement 3 Feet X 2 Feet X 3 Inches (“Sculpture”)
Earned Commission is over 20% (USD 208.33) per Sculpture
Potential Long Term Residual Income (10 years)
 
List Price per Sculpture is USD 3,750
70% Discount (from USD 3,750 to USD 995) and Full Future Refund for First 15,000 Buyers ONLY

Full details at Global Sales Agents Hiring Announcement
​
0 Comments

    Author

    DAJK GROUP is the place where investors, business owners and entrepreneurs can research and find useful information, insight, resources, advice, guidance and inspiration for acquiring funds for their project, acquisition for their net lease commercial real estate, increasing their assets and running their profitable business.

    Archives

    July 2023
    June 2023
    May 2023
    August 2019
    March 2019
    December 2018
    October 2018
    September 2018
    August 2018
    July 2018
    June 2018
    May 2018
    April 2018
    March 2018
    January 2018
    December 2017
    November 2017
    October 2017
    September 2017
    July 2017
    June 2017
    May 2017
    April 2017
    March 2017
    January 2017
    December 2016
    November 2016
    October 2016
    September 2016
    August 2016
    July 2016
    June 2016
    May 2016
    April 2016
    February 2016
    January 2016
    December 2015
    October 2015
    September 2015
    August 2015
    July 2015
    June 2015

    Categories

    All

    Contact Us

Services

Project Funding
Business Finance & Development

Net Lease CRE Investment
Concierge Services
​Finance & Asset Management


Company

About
Business Principles
Blog GEP
Blog

Support

Contact
Privacy Policy
Disclaimer
3592 Rosemead Blvd 526  
​Rosemead - California 91770

Los Angeles - USA
T:  +562.301.7231
© COPYRIGHT 2015. ALL RIGHTS RESERVED.
  • About
  • Project Funding
  • Financial Services & Asset Management
  • Net Lease Investment
  • Business Finance & Development
  • Consultant & Concierge Services
  • Investment & Business Resources
  • Products & Gift Ideas
  • GEP Blog
  • GEP Blog2
  • Business Principles
  • Contact