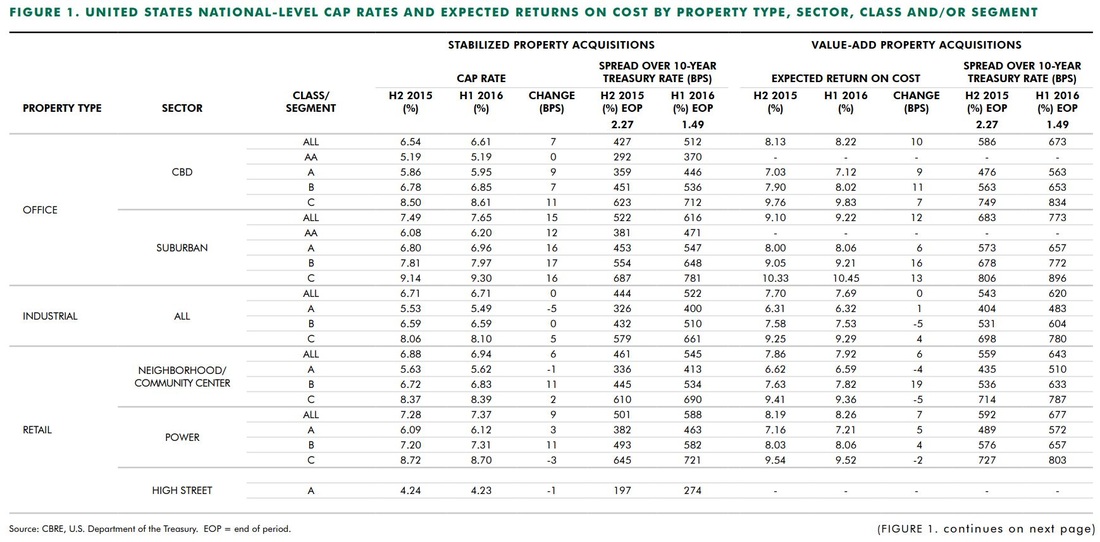
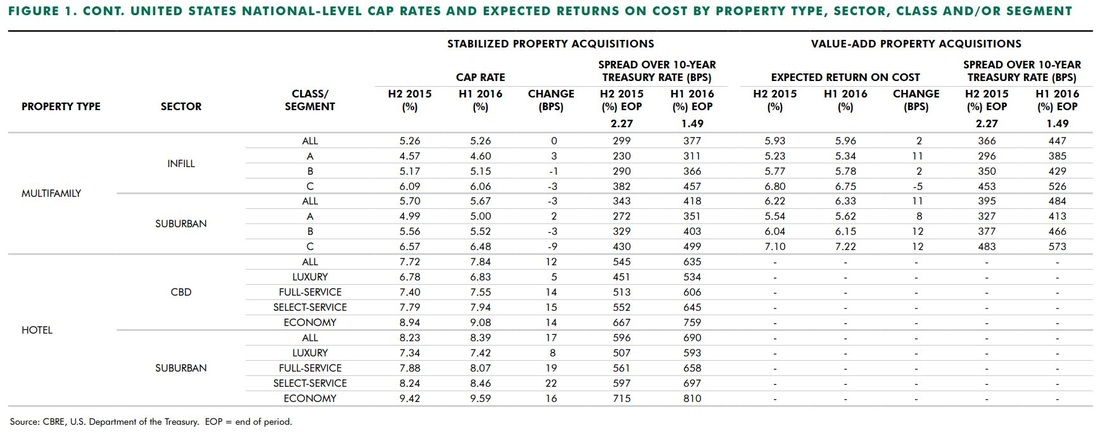
Highlights• Central Business District (“CBD” or “Downtown”) Office Sector • Suburban office Sector • Industrial Sector • Retail Sector • Multifamily properties Sector • Hotel Sector For all property types, little to no change is anticipated over the next six months in more than 60% of the markets. In markets where change is anticipated, cap rates are more likely to increase rather than decrease. Central Business District (“CBD” or “Downtown”) OfficeCap rates edged upward for all CBD office classes and tiers in H1 2016 with the exception of Tier II and III Class AA properties. Overall, the increases for both stabilized and value-add acquisitions were generally modest at 7 and 10 bps, respectively. Suburban officeSuburban office cap rates for stabilized assets and expected returns on cost for value-add acquisitions increased across all classes and, in most cases by a greater amount than those for CBD properties. Stabilized cap rates rose 15 bps, while value-add expected returns on cost increased 12 bps. Industrial SectorIndustrial cap rates were essentially flat for acquisitions of stabilized assets in H1 2016. The overall rate was 6.71%. Cap rates for stabilized Class A industrial space dropped 5 bps to 5.49%; Class B remained flat at 6.59%; and Class C increased 7 bps to 8.10%. The expected return on cost for value-add assets was stable at 7.69%. Retail SectorCap rates in the retail sector were relatively stable in H1 2016. A slow-down in cap rate compression among prime assets suggests that they may have reached a cyclical low in 2015. Meanwhile, modest cap rate expansion for Class B properties in both the neighborhood/community and power center segments signals investor concern about the future of non-prime assets in increasingly competitive retail markets. Multifamily propertiesMultifamily properties have the lowest overall cap rates of any major sector at 5.26% for stabilized infill and 5.67% for stabilized suburban assets. The H1 2016 survey revealed virtually unchanged cap rate conditions for stabilized infill and suburban multifamily acquisitions. The only notable movement of cap rates for stabilized assets was slightly downward in both infill and suburban Tier III rates, and in Class C suburban cap rates. Investors are still moving out the risk curve in terms of location and product, and still find value add assets very attractive. Hotel SectorThe upward shift of hotel cap rates that began in H1 2015 continued in the first half of 2016, with rates rising across most categories. Movements in hotel cap rates among most CBD and suburban property types showed minimal changes. Low barrier-to-entry hotel categories, such as economy and select-service, experienced slightly larger increases. Hotels recorded the highest increases in cap rates of any property sector. Cap rates for CBD hotels rose modestly from 5 to 15 bps, while those for suburban hotels rose 8 to 22 bps. For all property types, little to no change is anticipated over the next six months in more than 60% of the markets. In markets where change is anticipated, cap rates are more likely to increase rather than decrease. Approximately 20% of markets may experience increases of up to 25 bps, versus only 10% of markets that may experience decreases. Less than 5% of markets are likely to experience movement greater than 25 bps in either direction. Source: CBRE H1 Report [Discover more...]30-minutes Free Confidential ConsultationIf you need further clarifications or interest with net lease commercial real estate investment, please sign-up for our 30-minute Free Confidential Consultation.
0 Comments
Leave a Reply. |
AuthorDAJK GROUP is the place where investors, business owners and entrepreneurs can research and find useful information, insight, resources, advice, guidance and inspiration for acquiring funds for their project, acquisition for their net lease commercial real estate, increasing their assets and running their profitable business. Archives
July 2023
Categories |
Services |
Company |
|

