
|
Highlights:
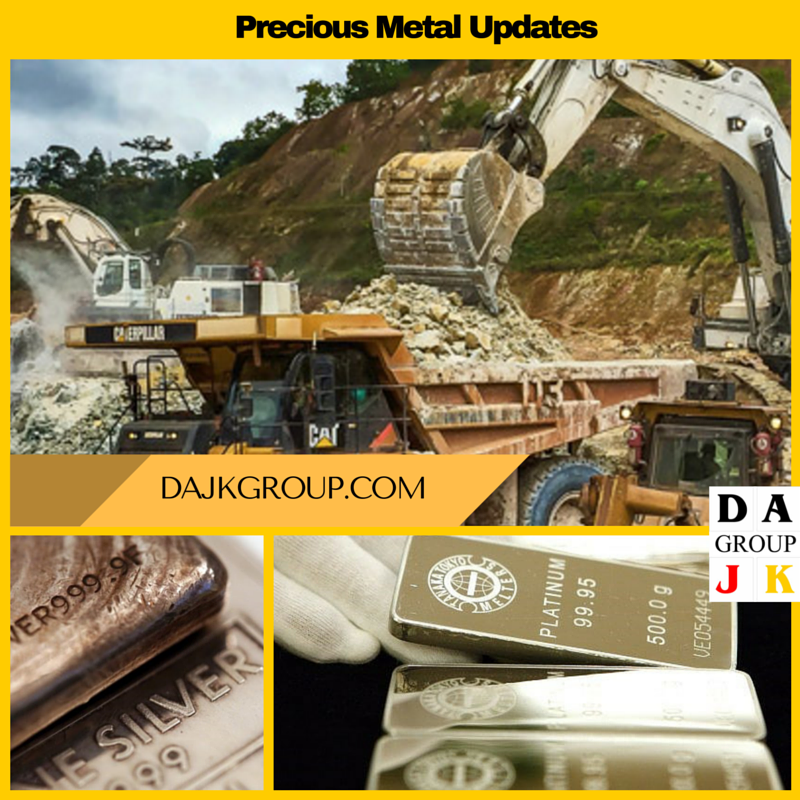 The world’s top 10 gold producing minesGold output across the globe hit an all-time high in 2015, climbing 1.8 percent to 3,211 tonnes. Much of this growth was led by Mexico, whose output increased double digits – 18% – from 112 tonnes in 2014 to 133 tonnes last year. Indonesia grew 20 percent, Kazakhstan 29 percent. This year, global production is expected to level out as project development budgets were slashed during the three-year gold bear market. But with gold prices rebounding, miners are in a good position to be much more profitable. Below, explore and discover the world’s top 10 gold producing mines: 10. Boddington Mine
The Boddington gold and copper deposit, located 75 miles southeast of Perth, Australia, is the country’s largest gold mine. The first gold was poured in 2009, and in 2011 Newmont produced its first one million ounces from the site. The mining company has identified gold reserves of 19.5 million ounces at Boddington and plans to spend half a billion dollars to expand production. 9. Lihir Mine
Gold was first discovered on Papua New Guinea’s Aniolam Island in 1982, and in 1997, the first gold was poured at the Lihir project, then managed by Rio Tinto. Australia-based Newcrest acquired the gold deposit in 2010 and has since struggled to keep operation costs under control. The company recently announced that expansion will cost a lot less expensive than initially thought, owing to new processing equipment that can more easily handle sulfur. 8. Peñasquinto Mine
Wholly owned by Canadian miner Goldcorp, the Peñasquinto mine is located in the State of Zacatecas. It’s the largest open pit mine in Mexico and the fifth largest silver mine in the world. Besides gold and silver, the project, in operation since March 2010, also yields zinc and lead. In 2007, Silver Wheaton entered into an agreement with Goldcorp to buy 25 percent of all silver output for the life of the mine. 7. Carlin Mine
Whether we’re talking about glittering Las Vegas casinos or mining, gold and Nevada are nearly synonymous. The state accounts for 75 percent of total U.S. output, and it’s even estimated to be responsible for producing 3 percent of all gold ever mined in human history. Much of this comes out of the state’s Carlin Trend, the most abundant goldfield in the Western Hemisphere. Along the trend is Newmont’s historic Carlin project, which consists of three open pits and four underground mines. In May 2015, the company celebrated 50 successful years of gold production at the site, which was the first in North America to generate more than one million ounces in a single year. 6. Yanacocha Mine
At more than 15,000 feet above sea level in Northern Peru, the Yanacocha project sits atop the Andean continental divide. It’s the largest gold mine in Latin America, covering some 535 square miles. Consisting of five open pit mines, it’s been producing gold since August 1993. Ownership of the mine is split among Newmont; Minas Buenaventura, a Peruvian company; and the International Finance Corporation, controlled by the World Bank. 5. Pueblo Viejo Mine
A joint venture between Barrick Gold, the world’s largest gold producer, and Goldcorp, the Pueblo Viejo mine is situated in the rolling green hills of central Dominican Republic, more than 60 miles north of its capital, Santo Domingo. The two Canadian companies took over the project in 2012 after the Dominican government unsuccessfully tried to mine it, with full production capacity reached in 2014. In August 2015, Barrick entered into a streaming contract with Royal Gold, whereby Royal agreed to front $610 million while Barrick is obligated to deliver 7.5 percent of all gold it produces at Pueblo Viejo. 4. Cortez Mine
Barrick employs 4,000 people in Nevada, or about a third of the state’s entire mining industry labor force. Many of these people work at the company’s Cortez operation, located in central Nevada. As one of Barrick’s most promising ore bodies, the site is scheduled to receive $153 million from the company through 2020. This will help expand its underground mining capacity, allowing it to produce an additional 300,000 ounces per year. 3. Goldstrike Mine
Since 1987, Barrick has operated the Goldstrike mine, also located in north-central Nevada. As the largest gold mine in North America, Goldstrike employs about 1,700 people. Over the last couple of decades, workers have developed a new way to process ore at the site, known as “total carbonaceous matter leach,” which will allow the company to repurpose lower-grade ores. The process is set to move out of its testing phase sometime this year. 2. Grasberg
High up in the rain-soaked mountains of Papua province, where earthquakes are not uncommon, sits the world’s largest known gold reserve and second largest copper reserve. Roughly 18,000 people work at the Grasberg mine, for which a village, called Tembagapura, was constructed, containing roads, housing, schools, a hospital and an airport. Nearly a mile wide, the project consists of both an open pit and underground operation. The company is currently in negotiations with the Indonesian government to extend its mining contract, which is scheduled to expire in 2021. 1. Muruntau Mine
Discovered in Uzbekistan’s arid Kyzyl Kum Desert in 1958, the Muruntau gold deposit began operations in 1967. Today, it’s the largest open pit mine by area and, at 1,900 feet deep, is the world’s fifth deepest. The project, which also contains huge deposits of turquoise and arsenic, sits atop what many geologists believe could be the world’s biggest gold reserve, with various estimates placing the amount at between 2,500 and a mind-boggling 5,300 tonnes. Top World Silver Producers – Countries, Companies and Mines |
| Rank 1 2 3 4 5 6 7 8 9 10 11 12 13 14 15 16 17 18 19 20 | Country Mexico Peru China Russia Australia Chile Bolivia Poland USA Argentina Guatemala Kazakhstan Sweden Canada India Indonesia Morocco Turkey Dominican Republic Armenia Rest of World World Total | Production 2014 186.3 122.9 112.5 46.1 53.9 50.6 43.2 40.7 37.9 29.1 27.6 19.0 12.7 15.9 8.4 7.7 8.8 6.6 4.5 3.7 30.2 868.3 | Production 2015 189.5 135.9 109.1 50.5 50.3 48.4 42.0 41.5 35.4 34.7 27.7 17.3 15.9 12.2 12.0 9.8 9.5 6.5 4.1 3.7 30.6 886.7 |
Source: GFMS, Thomson Reuters
In the companies table Fresnillo moved to world No. 1 in 2013 as Poland’s KGHM Polska Miedsz fell back to second and BHP Billiton fell back to 11th place following the spin-off during the year of South 32 which was a new entry in 15th place as operator of what GFMS reckons to be the world’s second largest primary silver mine in Cannington in Australia. BHP and South 32 combined production of 33.1 tonnes would have put it in 5th place.
Goldcorp sits in 3rd place largely through its Penasquito mine in Mexico where guided annual silver production in 2016 of between 22-24 million ounces would perhaps make it the world’s largest silver mine – but as it is also Goldcorp’s largest gold mine in production terms in 2015 it classifies its silver output as a byproduct! See listing of the world’s top primary silver mines later.
Top 20 Silver Mining Companies 2015 – million ounces
| Rank 1 2 3 4 5 6 7 8 9 10 11 12 13 14 15 16 17 18 19 20 | Company Fresnillo* KGHM Goldcorp Glencore/Xstrata Polymetal* Pan American* Volcan Buenaventura Codelco Tahoe* BHP Billiton Coeur* Sumitomo Hochschild* South 32 Boliden Southern Copper Hindustan Zinc Hecla* Penoles | Production 2014 40.4 40.4 36.8 35.5 28.7 26.1 22.5 19.7 20.4 20.3 34.0 17.2 14.2 16.2 No Data 10.4 13.0 8.4 11.3 14.1 | Production 2015 43.0 41.6 40.4 36.6 32.1 26.1 24.8 22.3 21.3 20.4 19.2 15.9 15.8 14.8 13.9 13.5 13.3 12.0 11.6 11.5 |
Source: GFMS, Thomson Reuters
*Companies for which mining of silver is their primary business
*Companies for which mining of silver is their primary business
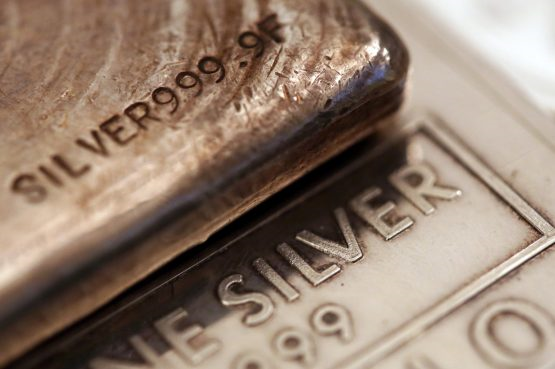
Silver Investment & Price
GFMS assesses identifiable silver investment, which includes physical bar investment, coins and medals, and exchange traded product (ETP) build, climbed 16% to a near record high in 2015. Silver coin and bar investment surged 24% to reach 292.3 million ounces, the highest annual demand level in GFMS’ records, overtaking the previous high in 2013. Coin and bar demand accounted for 25% of total physical demand in 2015, the highest market share on record and up from just 5% a decade earlier. Silver coin and medal demand amounted to 134.1 million ounces of demand last year due to unprecedented growth in several key markets, notably the United States and India. This perhaps indicates the strong investment demand for silver at the lower prices recorded during 2015. Of course the price has picked up fairly sharply since the beginning of the current year but still remains below levels achieved in early 2015.
Despite this rise in investment demand for physical metal, holdings in silver-backed Exchange Traded products (ETPs) declined by 17.7million ounces in 2015, finishing the year at 617.8 million ounces. However, demand in this investment category has rebounded with ETPs reaching 640.0 million ounces at the end of the first quarter 2016.
GFMS notes that an extremely challenging year for nearly all commodities, along with a continued slowdown in Chinese economic growth and a stronger U.S. dollar, led to a lower average annual silver price of US$15.68/oz in 2015. However, this lower price environment helped to boost physical demand, particularly as long term investors viewed lower prices as key entry points in expectation of future price appreciation. Silver is currently trading at over $17 an ounce.
Given that silver is both an investment metal, tending to move with the gold price, but with a little more volatility, and also an industrial metal, the combination of new momentum in gold and better supply/demand fundamentals as suggested by the GFMS report, could bode well for silver throughout the rest of the year providing gold’s price strength can be maintained. Both industrial and investment demand are currently strong which gives the silver bulls a degree of confidence that the past four and a half years of declining silver prices may be behind us. Silver is definitely worth watching.
Platinum, Palladium Seen Remaining In Deficit
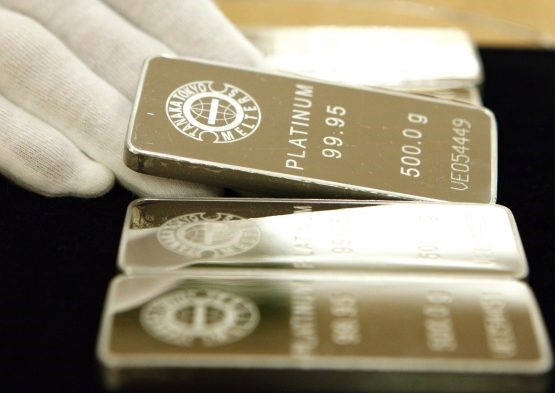
Platinum will remain in a global deficit this year as carmakers and other industrial users boost demand while supplies remain stagnant, according to Johnson Matthey. Palladium consumption will also exceed supply.
Platinum purchases by automakers will climb almost 2%, leading to an 861 000-ounce shortage, Johnson Matthey said in a report on Monday. Palladium’s shortfall will total 843 000 ounces. That compares with a deficit last year of 285 000 ounces for platinum and 100 000 ounces for palladium, the latest data from the company show.
Prices of the metals, which are mostly used to curb harmful vehicle emissions, rebounded this year partly as expectations that US interest rates will remain low boosted the appeal of precious metals. The gains will probably extend through 2017 as stricter environmental rules around the world increase usage from the auto industry, a Bloomberg survey of analysts and traders showed.
Johnson Matthey, which makes one in three car auto catalysts, released its outlook for this year as platinum miners to refiners gathered in London for the industry’s annual Platinum Week.
A drop in platinum supply from mines in South Africa, the world’s biggest producer, will be broadly offset by higher recycling from the auto and jewelry industries, according to the report. Palladium supply will increase “marginally” as recycled output more than makes up for lower production.
Estimate breakdown:
- Platinum auto demand will rise to 3.5 million ounces, while other industrial usage is expected to increase almost 10%.
- Global platinum jewelry demand is seen at 2.93 million ounces, aided by more purchases in China.
- Carmarkers will increase palladium demand to 7.76 million ounces.
Sources: Bloomberg, GFMS, Thomson Reuters, Company reports, Sharps Pixley
About Johnson Matthey
Johnson Matthey is a global specialty chemicals company underpinned by science, technology and its people. A leader in sustainable technologies, many of our products enhance the quality of life of millions through their beneficial impact on the environment, human health and wellbeing. Johnson Matthey is building its position as a supplier of functional materials to the lithium-ion battery industry with a focus on automotive applications. We are a leading supplier of lithium iron phosphate for range of light and heavy duty powertrain applications which is complemented with capability in the design and supply of high performance, fully integrated battery systems. In addition, we have a strong position in specialist nickel catalysts for chemical industry customers. This enables us to leverage our technical and manufacturing know-how in nickel based products for the benefit of our battery materials' customers.
Johnson Matthey has operations in over 30 countries and employs around 13,000 people. Its products and services are sold across the world to a wide range of advanced technology industries.
About GFMS
The GFMS team at Thomson Reuters is recognized as one of the world’s leading economics consultants in precious metals, specializing in research into the global gold, silver, platinum, palladium, and copper markets. GFMS analysts present regularly at international conferences and seminars on precious metals and commodities and are frequently quoted in the media for their views.
GFMS is credited with producing the most authoritative surveys of the gold and silver markets, the annual GFMS Gold Survey and World Silver Survey, and GFMS’ gold and silver supply/demand data forms the global benchmark; the international gold and silver markets are largely dependent on GFMS’ statistics. The GFMS team at Thomson Reuters also produce a range of other publications dealing with all aspects of the precious metals markets, and provide consultancy services in the form of tailor-made research into selected areas of the precious metals markets.
Thomson Reuters is the world's leading source of intelligent information for businesses and professionals. The acquisition of GFMS strengthens its offerings to the metals sector by combining GFMS’ powerful forecast analytics and rich fundamentals content with Thomson Reuters leading news and pricing service. GFMS Surveys and Forecasts, and the Mine Economics database are now available on Thomson Reuters Eikon.
Specialties
Forecast, Supply, Demand, Price, Precious, Base, Metals, Gold, Mine Costs, Platinum, Silver, Copper, Palladium, Lead, Aluminium, Tin, Nickel, Zinc
- Industry: Mining & Metals
- Type: Public Company
- Headquarters: 30, South Colonnade London,E145EP United Kingdom
- Company Size: 11-50 employees
- Founded: 1989
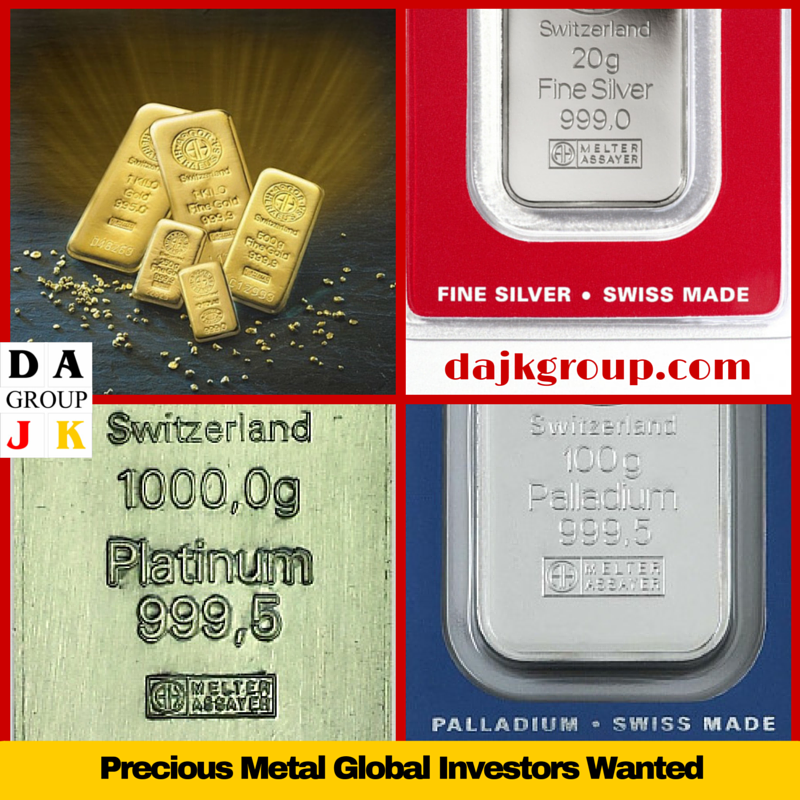 | For additional information, please contact us. We will email you additional information within 24 hours. Precious Metal Worldwide-Investors Wanted. [Discover more...] |
0 Comments
Leave a Reply.


Author
DAJK GROUP is the place where investors, business owners and entrepreneurs can research and find useful information, insight, resources, advice, guidance and inspiration for acquiring funds for their project, acquisition for their net lease commercial real estate, increasing their assets and running their profitable business.
Archives
July 2023
June 2023
May 2023
August 2019
March 2019
December 2018
October 2018
September 2018
August 2018
July 2018
June 2018
May 2018
April 2018
March 2018
January 2018
December 2017
November 2017
October 2017
September 2017
July 2017
June 2017
May 2017
April 2017
March 2017
January 2017
December 2016
November 2016
October 2016
September 2016
August 2016
July 2016
June 2016
May 2016
April 2016
February 2016
January 2016
December 2015
October 2015
September 2015
August 2015
July 2015
June 2015